In today’s architecture and city planning, using space well is as important as creating designs. Geographic Information Systems (GIS) provide the analytical tools needed to make informed decisions. These tools can evaluate site suitability, assess environmental risks, or plan resilient infrastructure. For students, access to high-quality geospatial data is no longer optional, it is an essential skill-building resource shaping their ability to integrate sustainability, ecological function, and resilience into real-world projects.
This article offers a list of free GIS data portals every architecture and planning student should bookmark. It shows platforms offering global coverage, region-specific data, and specialized thematic layers such as climate projections, land use, and population density. These sources allow learners to analyze different levels of detail, from local zoning maps to global environmental data, without subscription fees. The guide uses well-known resources to explain each portal’s strengths. The article explains how each resource fits into architectural and planning workflows. This helps students understand how the resources are used and why they are relevant to design. The result is a practical, academically grounded toolkit for integrating free GIS data into the design process, fostering more informed, inclusive, and sustainable spatial solutions.
OpenStreetMap: A Living Global Map for Design Foundations
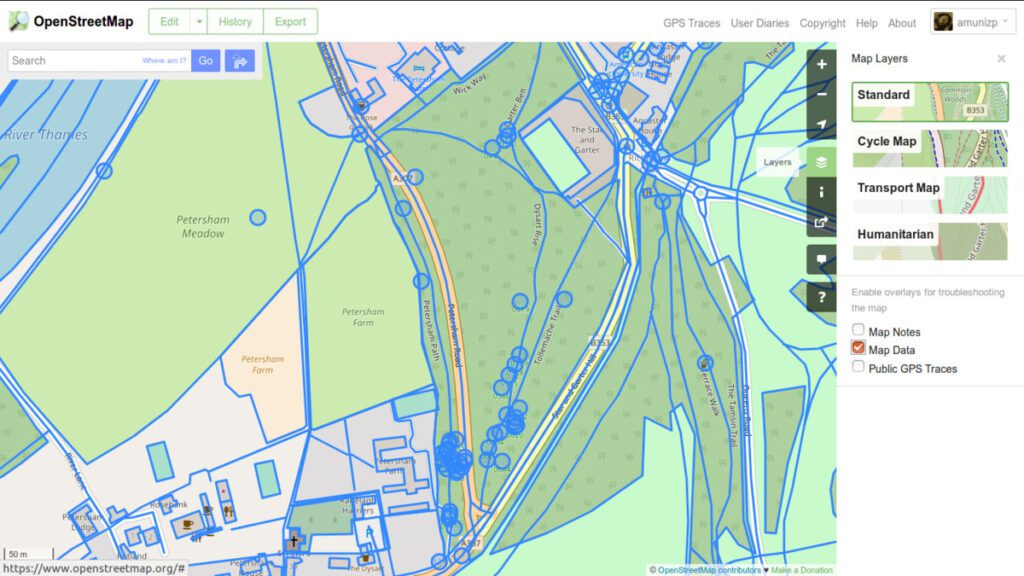
OpenStreetMap (OSM) is one of the world’s most comprehensive open mapping projects. It is built and maintained by a global community. The platform contains detailed data on roads, pathways, buildings, waterways, parks, and how the land is used. This data is updated daily by contributors worldwide.
OSM is a useful tool for architecture and planning students. It can be used for studying city design, checking how easy it is to walk somewhere, and figuring out how accessible places are. You can import it directly into GIS tools like QGIS or even into parametric modeling environments such as Rhino/Grasshopper for 3D contextual modeling. One example of a sustainable design is the Humanitarian OpenStreetMap Team’s mapping of Nepal after the earthquake. This mapping provided critical infrastructure data for recovery efforts. OSM’s building footprint data can also be used with solar radiation models to determine the best places to put rooftop solar panels.
Community-driven mapping with OpenStreetMap empowers architects and planners to access up-to-date, detailed spatial data for design and resilience planning.
Natural Earth: Multi-Scale Basemaps for Thematic Mapping
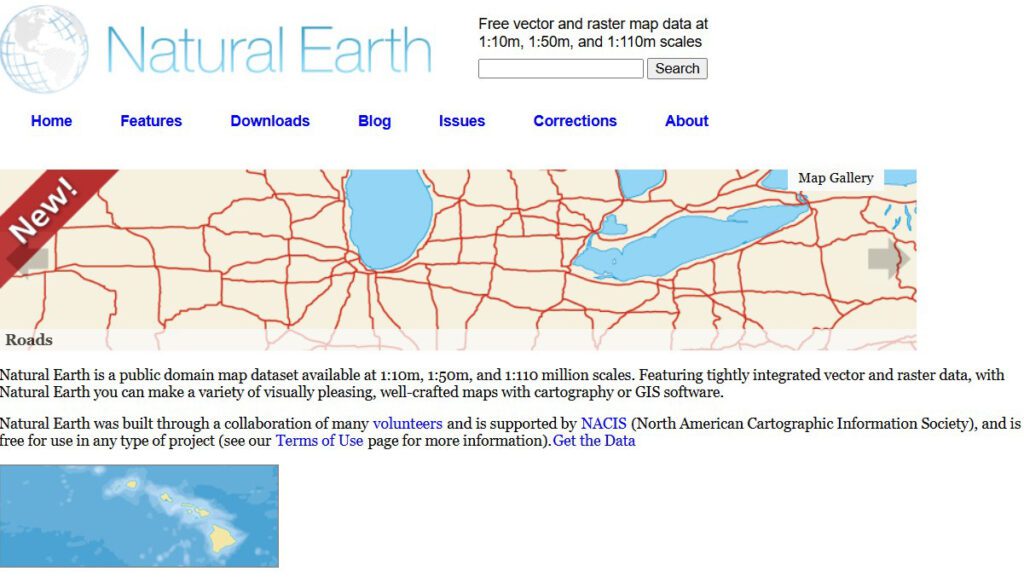
Natural Earth is a free public-domain dataset that offers both vector and raster formats, available at three primary map scales—1:10m, 1:50m, and 1:110m. The project was designed to provide high-quality spatial data that works seamlessly at each scale. Users can move between global, regional, and national perspectives without mismatched boundaries or distortions. Physical datasets include rivers, lakes, coastlines, mountain ranges, and terrain shading. These natural features provide a backdrop for environmental analysis. Cultural datasets include international and local boundaries, cities, populated areas, roads, and railways. Raster relief layers are often used for shaded relief maps, providing elevation data that makes maps more realistic and visually deep.
Natural Earth is valuable for students and professionals because it focuses on making maps clear and easy to understand. The data is generalized to remain readable when used on smaller maps, making it ideal for showing large-scale spatial patterns rather than small details. This makes it particularly good for regional master planning, storytelling, and visualizing environmental systems like watershed networks or ecoregions. For eco-friendly landscaping, its layers show environmental signs like biodiversity hotspots or areas vulnerable to climate change, helping them stand out in presentations and planning documents without visual clutter.
Natural Earth’s public-domain vector and raster datasets provide clean, multi-scale basemaps ideal for thematic cartography and regional planning projects.
Source: Website Link
USGS Earth Explorer: Remote Sensing for Terrain and Land Cover Analysis
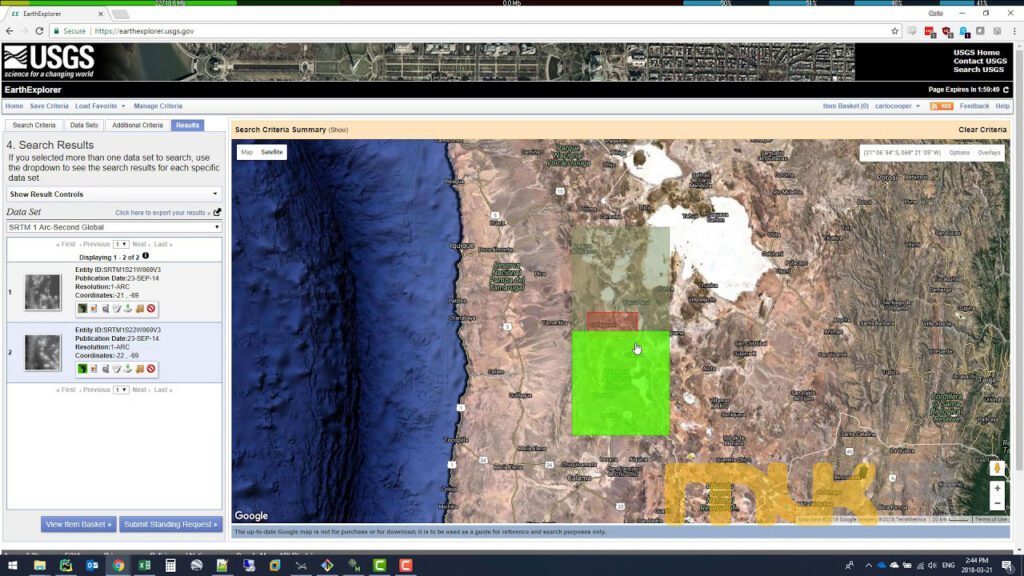
The U.S. Geological Survey’s Earth Explorer portal offers free access to a large collection of satellite images and Digital Elevation Models (DEMs). The data sets include Landsat, Sentinel, ASTER, MODIS, and global SRTM elevation data. The platform also provides historical aerial photography, nighttime light imagery, vegetation indices, and specialized land cover products. This diversity allows users to study both present conditions and long-term environmental change. The interface includes powerful search filters for selecting data by date range, cloud cover percentage, spatial extent, or sensor type. This ensures that the downloaded data matches specific project needs.
Students studying architecture and planning can use DEMs to create models of surface runoff, evaluate slope stability, and develop designs for drainage that adapt to the climate. For example, sustainable urban drainage systems (SUDS) often require detailed elevation modeling to manage flood risks in urban neighborhoods. In ecological architecture, using models of the land and information from satellite images about plants helps design sites that support different types of animals and plants while reducing the negative effects on the environment.
The USGS Earth Explorer interface enables users to locate and download satellite imagery and elevation data.
Copernicus Open Access Hub: High-Resolution Multispectral Imagery
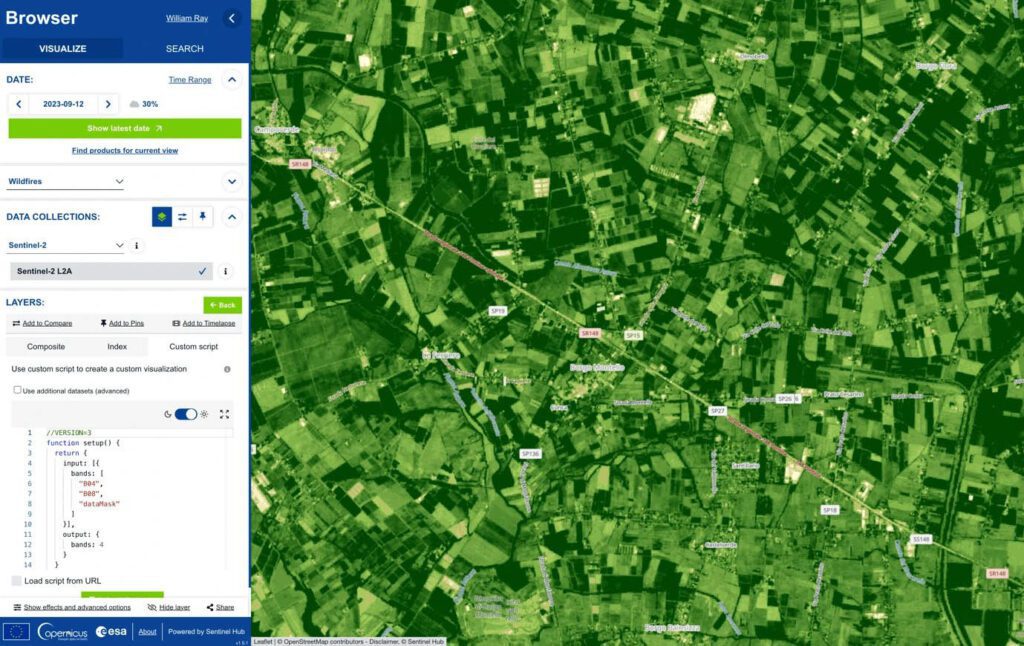
The European Space Agency’s Copernicus Open Access Hub provides free satellite data, particularly Sentinel-2 multispectral imagery, with a revisit time of five days. This dataset allows us to create detailed maps of plants, study the urban heat island effect, and monitor urban expansion. Students studying architecture can use NDVI (Normalized Difference Vegetation Index) data from Sentinel-2 to assess the health of green spaces in urban areas. This information can help inform decisions about green roofs and vertical gardens. The Urban Atlas combines satellite images with detailed maps of the land for over 800 European cities. This helps people plan for sustainable transportation and adapting to climate change.
The Copernicus program includes more than just Sentinel-2. It also includes Sentinel-1 radar data, which is perfect for monitoring land deformation, and Sentinel-3 data for large-scale environmental parameters such as sea surface temperature and land surface temperature. These additional datasets can be very useful for planning along the coast, for mapping areas at risk of flooding, and for monitoring hazards related to the climate. The Open Access Hub interface lets users filter images by sensing period, cloud coverage, and geographic area. This makes it easier to find high-quality data for specific project needs.
Copernicus Open Access Hub visualization of Sentinel-2 multispectral imagery, used for vegetation health monitoring, urban heat mapping, and land-use.
NASA SEDAC: Socioeconomic and Environmental Integration
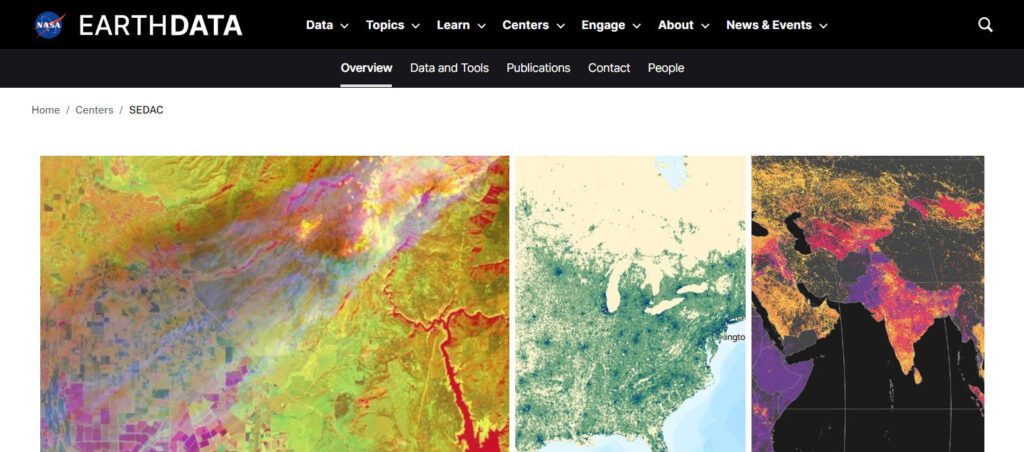
NASA’s Socioeconomic Data and Applications Center (SEDAC) provides datasets that link environmental changes with human impacts. This includes population density grids, maps of poverty, urban expansion, and environmental hazards. SEDAC also offers thematic datasets, such as global urban extents, climate risk indices, and infrastructure distribution. These datasets allow users to explore how human settlements interact with environmental systems. These data sets are made to work together across different areas, from local neighborhoods to entire continents.
To make sure that urban resilience planning is fair, students can overlay population density with climate hazard zones to identify vulnerable communities. This makes sure that things like flood defenses or cooling centers are put in the places where they are most needed. For example, if we map where there is a lot of heat exposure, we can see which neighborhoods have a lot of elderly people. This helps us plan ways to help those neighborhoods. SEDAC can combine demographic, economic, and environmental data to make better plans that deal with both physical and social problems.
NASA SEDAC’s integrated datasets combine environmental indicators with socioeconomic variables, enabling planners to assess human vulnerability.
FAO GeoNetwork: Agricultural and Land Resource Insights
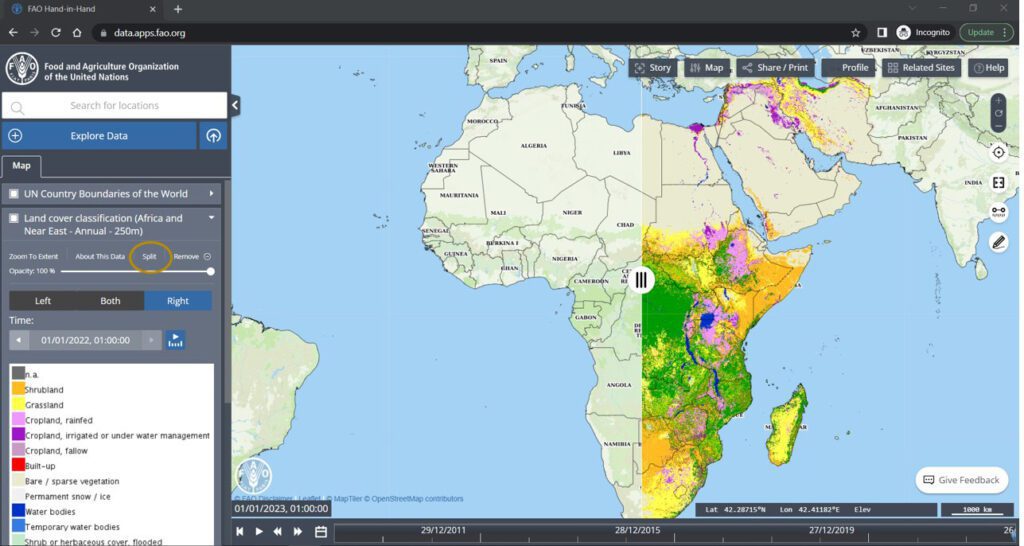
The Food and Agriculture Organization’s GeoNetwork provides datasets on agriculture, forestry, fisheries, and soils around the world. These resources are very important when planning agriculture in areas near cities or evaluating how development affects rural environments. The platform offers layers on different types of crops, irrigation systems, soil fertility, land degradation, and forest cover. All of these layers can be downloaded in formats that can be used with Geographic Information Systems (GIS). It also includes data sets that show changes in agricultural productivity, land use, and resource availability over time.
Students studying architecture who are working on projects to ensure that everyone has enough food can use maps from the Food and Agriculture Organization (FAO) to find places for community gardens or urban farms. When we combine this information with data about the population and transportation, we can make sure that everyone has access to fresh food and that the supply chain is strong enough to deal with any problems. This helps achieve sustainable development goals by incorporating ecological functions into urban design.
FAO GeoNetwork land cover classification map for Africa and the Near East, supporting sustainable land management and agricultural planning.
Global Human Settlement Layer: Mapping Urban Form and Density
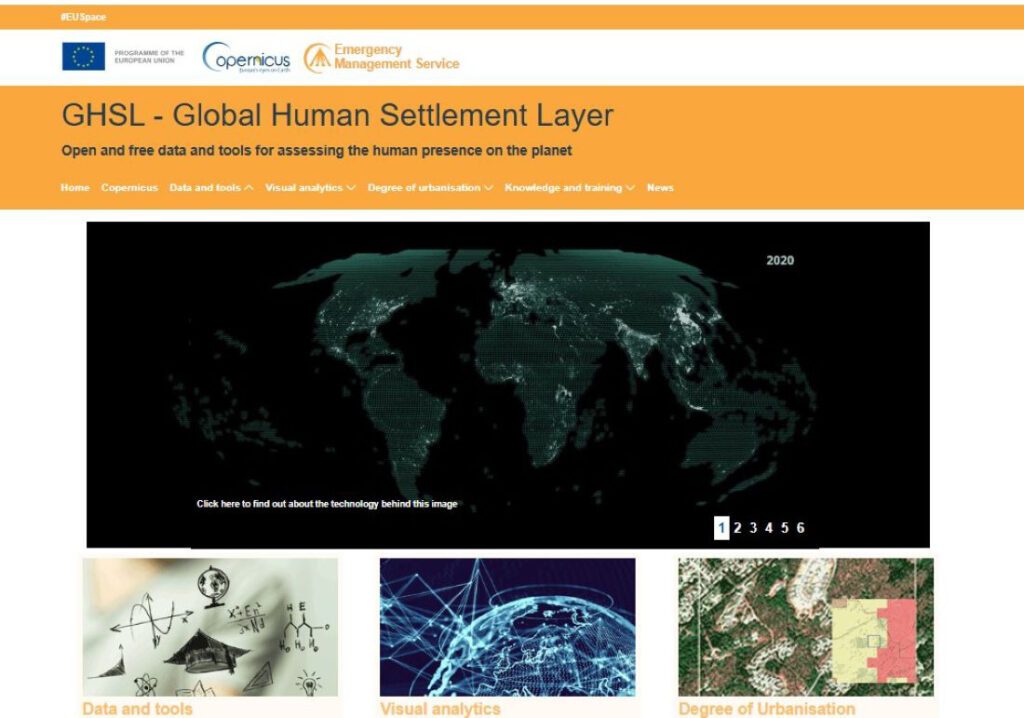
The European Commission’s Joint Research Centre produced the Global Human Settlement Layer (GHSL) maps. These maps show built-up areas and how the population has changed over time. The dataset comes from satellite imagery and census data. This data is processed to produce consistent, comparable information for multiple years, including 1975, 1990, 2000, and 2015. By studying GHSL data from 1975 to the present, students can see how cities have grown and test ways to build more densely. This is very important for reducing the negative environmental effects of urban growth while making public transportation more efficient. The information is available at different levels of detail, which allows for both global comparisons and more in-depth studies of specific countries or regions.
When planning for resilience, GHSL can be used with hazard exposure maps to decide which climate-adaptive improvements are a priority in areas where many people live and where there is a high risk of damage. For example, people who plan for floods can put floodplain maps over maps of where people live and work. It also helps them decide if people need to be moved to a new place because of the risk of flooding.
Global Human Settlement Layer (GHSL) mapping the distribution and density of built-up areas worldwide.
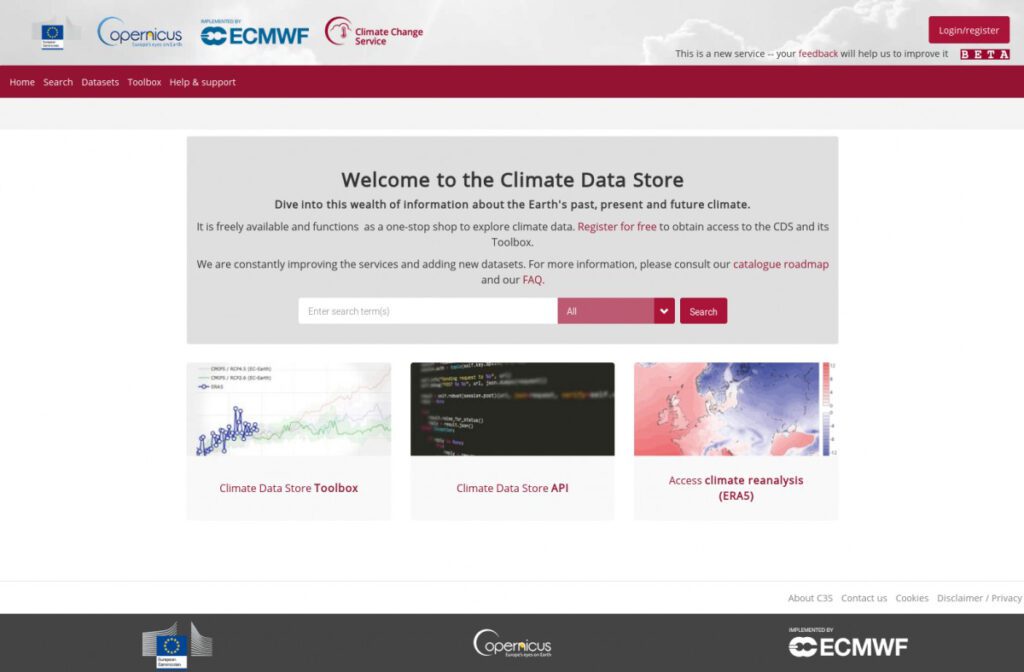
Climate Data Store: Future-Proofing Design with Projections
The Copernicus Climate Data Store (CDS) provides historical climate data and future projections under different emissions scenarios. The things that we study include temperature, precipitation (how much rain or snow there is), wind, and extreme weather events like hurricanes, tornadoes, and blizzards. The platform offers two types of datasets. The first type is called reanalysis datasets. These combine historical observations with models to make accurate past climate reconstructions. The second type is called climate projection datasets. These are generated from global and regional climate models. Users can filter data by region, time period, and emissions pathway. This makes it easy to use for different projects.
Students can use CDS data in performance simulations for buildings and landscapes. For example, they can test how well a plaza design can reduce heat under the projected 2050 climate conditions. For example, the case studies of Rotterdam’s water plazas show how climate projections can be used to create designs that are useful in many ways and can withstand challenges. These water plazas are public spaces that also serve as stormwater retention basins. Students can create maps of future heat stress zones, predict changes in precipitation patterns, and plan green infrastructure networks.
The homepage of the Climate Data Store, including the function to search for datasets and other related services.
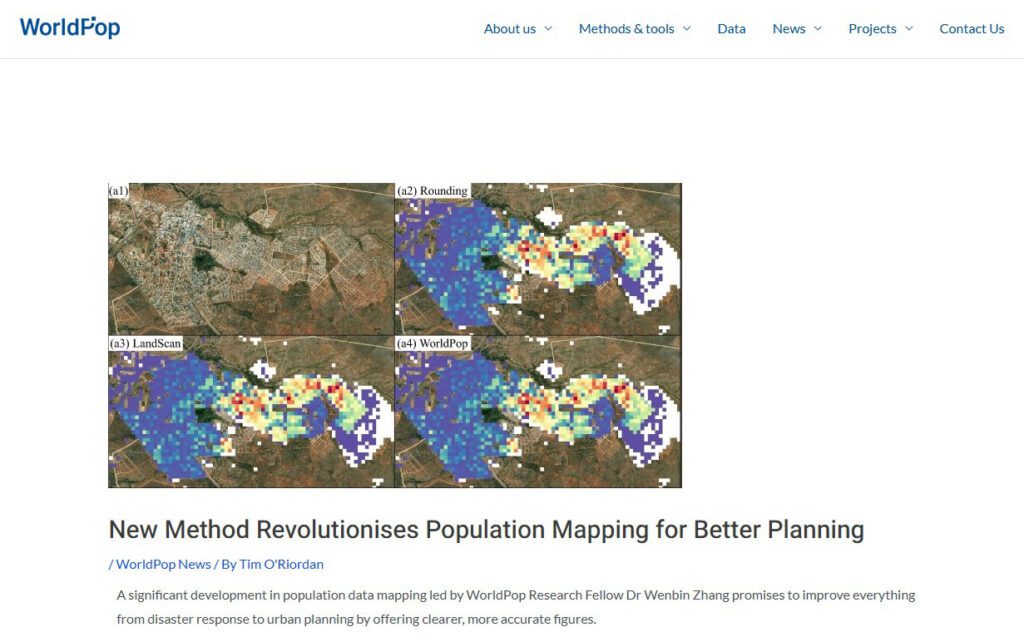
WorldPop: Demographic Precision for Service Planning
WorldPop provides high-resolution population data, which is more detailed than data from censuses. In urban design, this data supports making sure that amenities like clinics, schools, and transport hubs are distributed fairly. By combining WorldPop data with flood risk layers, planners can develop evacuation strategies that prioritize the most at-risk populations. For planning sustainable transportation, detailed population maps show the best places to put transit stops. This helps reduce travel emissions and make it easier for people to get around.
The WorldPop datasets are available at resolutions down to 100 meters in many regions, allowing for precise analysis at the neighborhood scale. The data is updated regularly and uses a mix of census records, satellite images, and geospatial modeling to estimate the population distribution in areas where traditional census data is outdated or unavailable. This helps architecture and planning students make more accurate service catchment analyses. This means that resources are directed where they will have the greatest impact. When combined with socioeconomic indicators or environmental hazard maps, WorldPop becomes a powerful tool for promoting equity, disaster preparedness, and climate adaptation in urban and rural contexts alike.
WorldPop’s high-resolution population mapping methods enhance accuracy for urban planning, disaster response, and equitable service distribution.
Free GIS data is now a key part of design education in architecture and planning. OSM’s community-driven maps and Copernicus’s climate projections are examples of portals that give students the tools to consider ecological function, resilience, and equity in their designs. These resources help future professionals study landscapes and cities using science while considering social and environmental issues. They help address climate challenges, preserve ecosystems, and plan inclusive urban spaces without financial barriers.
Learning to use these GIS portals is more than just a technical skill. It’s a commitment to creating environments that are sustainable, adaptable, and just for the future. With these tools, students can move confidently from designing ideas to making informed, data-driven changes to cities.
References
European Space Agency. (n.d.). Copernicus Open Access Hub. Retrieved August 8, 2025, from https://scihub.copernicus.eu/
Food and Agriculture Organization of the United Nations. (n.d.). FAO GeoNetwork. Retrieved August 8, 2025, from https://data.apps.fao.org/
NASA Socioeconomic Data and Applications Center (SEDAC). (n.d.). SEDAC. Retrieved August 8, 2025, from https://sedac.ciesin.columbia.edu/
European Commission, Joint Research Centre. (n.d.). Global Human Settlement Layer (GHSL). Retrieved August 8, 2025, from https://ghsl.jrc.ec.europa.eu/
Seakmy Ty is a Cambodian architecture student pursuing a master’s degree in urban planning in France. Originally from Phnom Penh, a city that is rapidly changing due to urban growth, she has developed a deep passion for sustainable urban design and planning. She has received academic training in smart city systems, energy efficiency, and resilience strategies. Seakmy is particularly interested in how design and governance can create cities that balance rapid development with long-term environmental and social well-being.
“Let’s explore the new avenues of Urban environment together “
We use cookies on our website to give you the most relevant experience by remembering your preferences and repeat visits. By clicking “Accept”, you consent to the use of all the cookies. Read More
This website uses cookies to improve your experience while you navigate through the website. Out of these, the cookies that are categorized as necessary are stored on your browser as they are essential for the working of basic functionalities of the website. We also use third-party cookies that help us analyze and understand how you use this website. These cookies will be stored in your browser only with your consent. You also have the option to opt-out of these cookies. But opting out of some of these cookies may affect your browsing experience.
Necessary cookies are absolutely essential for the website to function properly. These cookies ensure basic functionalities and security features of the website, anonymously.
Cookie
Duration
Description
cookielawinfo-checkbox-analytics
11 months
This cookie is set by GDPR Cookie Consent plugin. The cookie is used to store the user consent for the cookies in the category "Analytics".
cookielawinfo-checkbox-functional
11 months
The cookie is set by GDPR cookie consent to record the user consent for the cookies in the category "Functional".
cookielawinfo-checkbox-necessary
11 months
This cookie is set by GDPR Cookie Consent plugin. The cookies is used to store the user consent for the cookies in the category "Necessary".
cookielawinfo-checkbox-others
11 months
This cookie is set by GDPR Cookie Consent plugin. The cookie is used to store the user consent for the cookies in the category "Other.
cookielawinfo-checkbox-performance
11 months
This cookie is set by GDPR Cookie Consent plugin. The cookie is used to store the user consent for the cookies in the category "Performance".
viewed_cookie_policy
11 months
The cookie is set by the GDPR Cookie Consent plugin and is used to store whether or not user has consented to the use of cookies. It does not store any personal data.
Functional cookies help to perform certain functionalities like sharing the content of the website on social media platforms, collect feedbacks, and other third-party features.
Performance cookies are used to understand and analyze the key performance indexes of the website which helps in delivering a better user experience for the visitors.
Analytical cookies are used to understand how visitors interact with the website. These cookies help provide information on metrics the number of visitors, bounce rate, traffic source, etc.
Advertisement cookies are used to provide visitors with relevant ads and marketing campaigns. These cookies track visitors across websites and collect information to provide customized ads.