QGIS, an open-source Geographic Information System, has transformed how spatial data is analysed and visualised. This article explores ten powerful tools within QGIS that can significantly elevate your spatial analysis skills. From basic functions like field calculations to advanced plugins such as Time Manager and Semi-Automatic Classification Plugin (SCP), these tools empower users to handle complex geospatial workflows. Whether you’re working in urban planning, environmental monitoring, or community mapping, mastering these tools enhances precision and storytelling. With QGIS’s user-friendly interface and plugin-rich ecosystem, spatial analysts can model terrain, visualize temporal change, automate map production, and much more. This guide offers insights into how each tool works, its key features, and ideal use cases making it especially valuable for students, professionals, and researchers navigating geospatial tasks.
Whether you are just beginning or aiming to refine your skills, these tools will help streamline processes and produce high-quality outputs.
1. Field Calculator
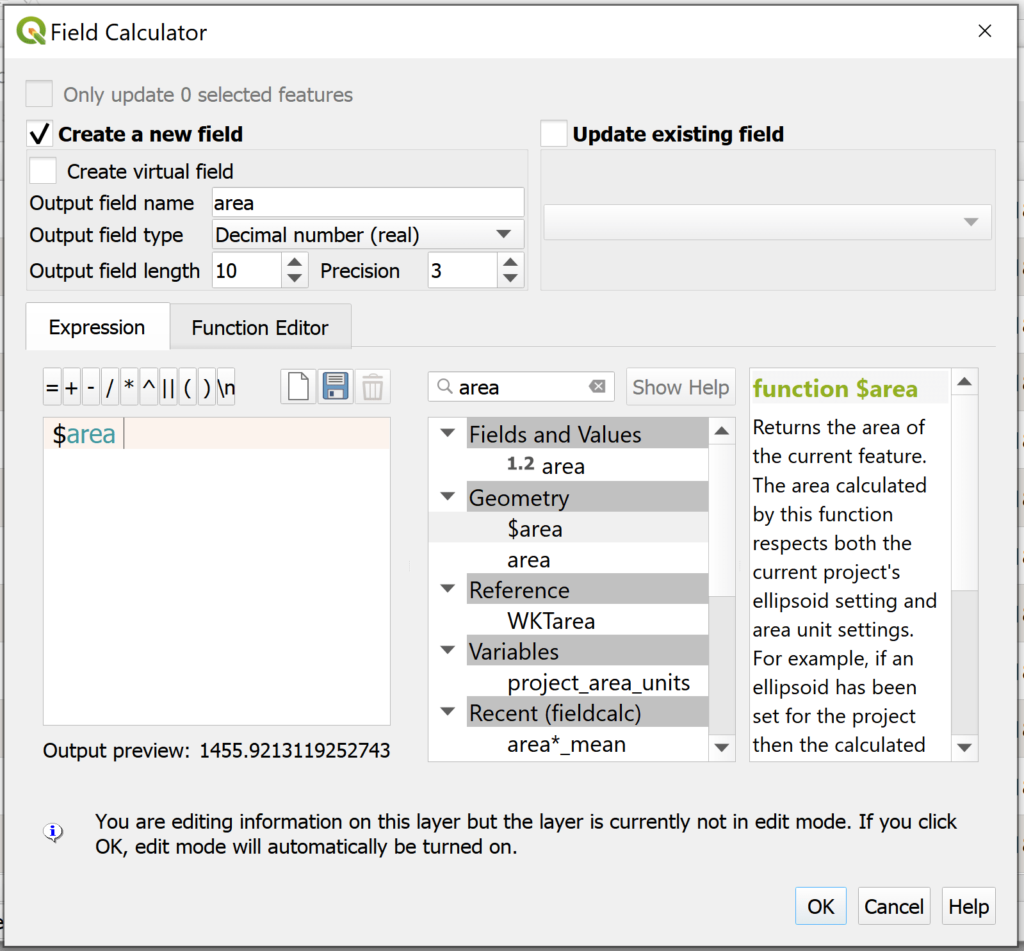
The Field Calculator in QGIS is a foundational tool for creating and updating attribute data. It allows users to compute values using mathematical expressions, string functions, and geometry-related formulas. Analysts can generate new fields, reclassify data, and perform conditional logic based on existing fields. For example, calculating population density by dividing total population by area or generating custom labels for visualization. The calculator supports a wide variety of data types and is integral for tasks like creating spatial indices, data cleaning, and categorical grouping. It is especially useful in pre-analysis stages where accurate attribute data is essential for mapping, querying, or running geospatial models. With batch capabilities and support for Python-based expressions, it ensures efficiency and consistency in datasets.
Custom attribute calculation using the Field Calculator in QGIS
Source: Website Link
2. Processing Toolbox
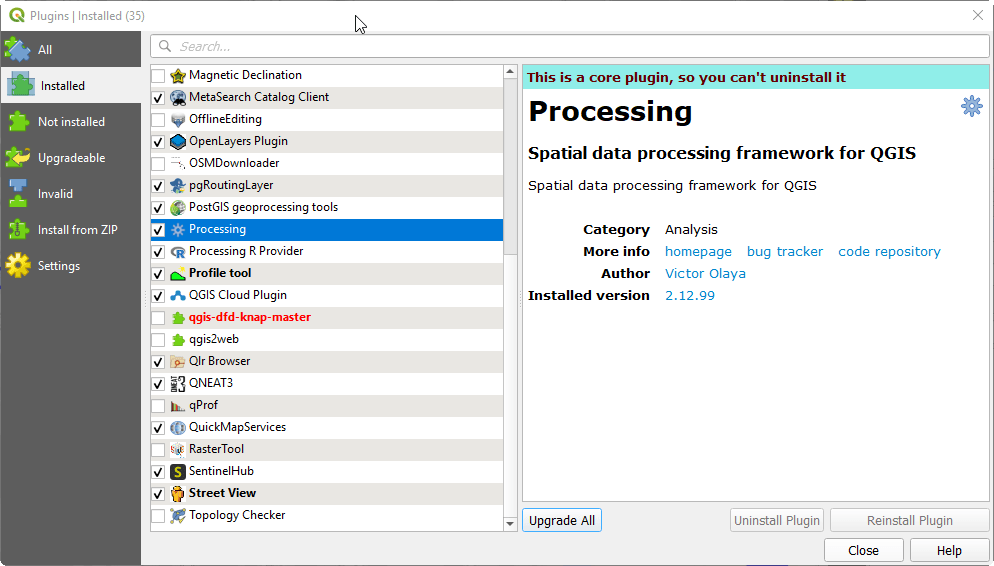
The Processing Toolbox is the gateway to QGIS’s geospatial capabilities. It integrates algorithms from QGIS core tools, GRASS GIS, SAGA GIS, and more. This toolbox enables users to conduct analyses such as buffering, intersecting layers, terrain modeling, and hydrology-based computations. The toolbox allows for chaining algorithms through graphical models, thereby automating workflows. Whether calculating slope and aspect from DEMs or extracting features within a boundary, the toolbox offers a streamlined interface to run tasks with minimal coding. It supports batch processing and allows users to save models for future reuse. It’s indispensable for spatial analysts dealing with large datasets or repetitive tasks, making data analysis more accessible and customizable.
Multi-source geoprocessing operations within QGIS’s Processing Toolbox
Source: Website Link
3. TimeManager Plugin
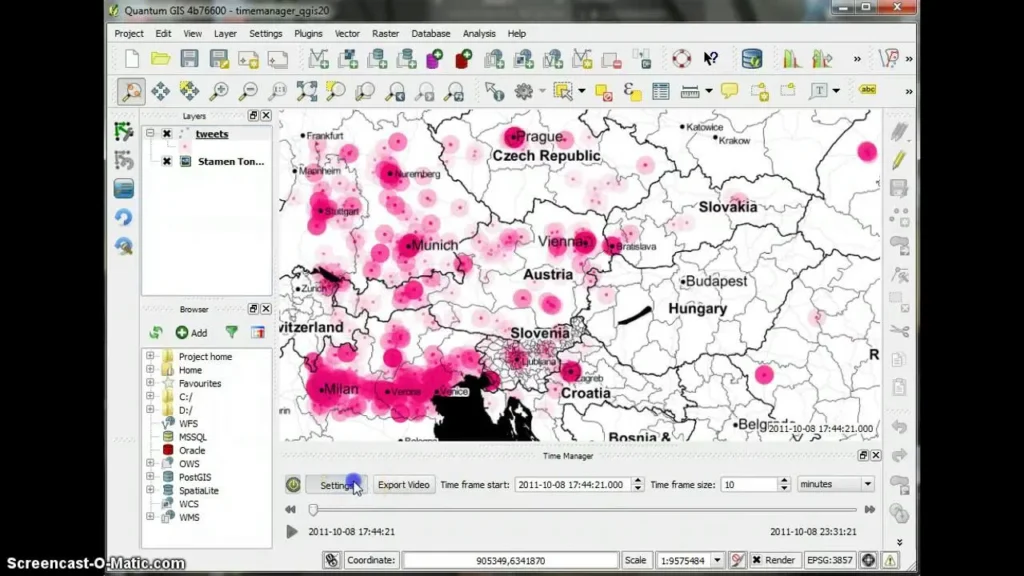
The TimeManager plugin enables temporal visualization of spatial data. By adding a time dimension to layers, users can animate how data changes over days, months, or years. This is particularly useful for visualizing land use change, transportation patterns, or demographic shifts. The plugin supports both vector and raster data and allows users to export animations for presentations or reporting. With features like custom time formats and frame rates, TimeManager enhances storytelling by turning static maps into dynamic temporal narratives. Its intuitive interface helps track evolving phenomena and improves communication of complex data trends over time.
Temporal data animation using the TimeManager plugin in QGIS
Source: Website Link
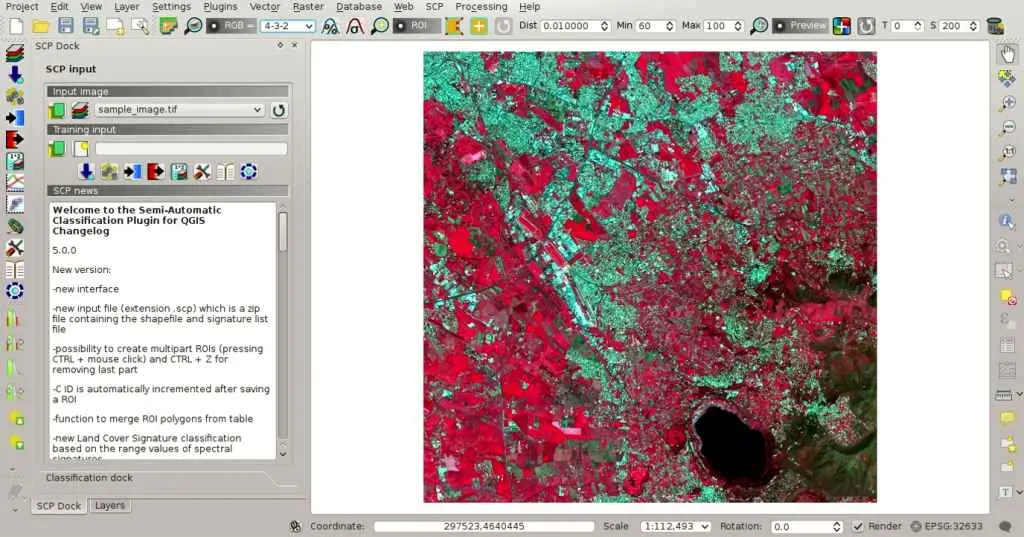
4. Semi-Automatic Classification Plugin (SCP)
The Semi-Automatic Classification Plugin is a robust tool for land cover classification using satellite imagery. SCP simplifies remote sensing workflows by supporting image download (Landsat, Sentinel), preprocessing, and supervised classification. Users can train the algorithm using sample areas and classify imagery into vegetation, water, urban, and other classes. SCP also allows for accuracy assessment and change detection. It is highly valuable in environmental monitoring, urban expansion studies, and conservation planning. The plugin makes complex remote sensing accessible within the QGIS environment without needing proprietary software.
Satellite-based land cover classification workflow in SCP
Source: Website Link
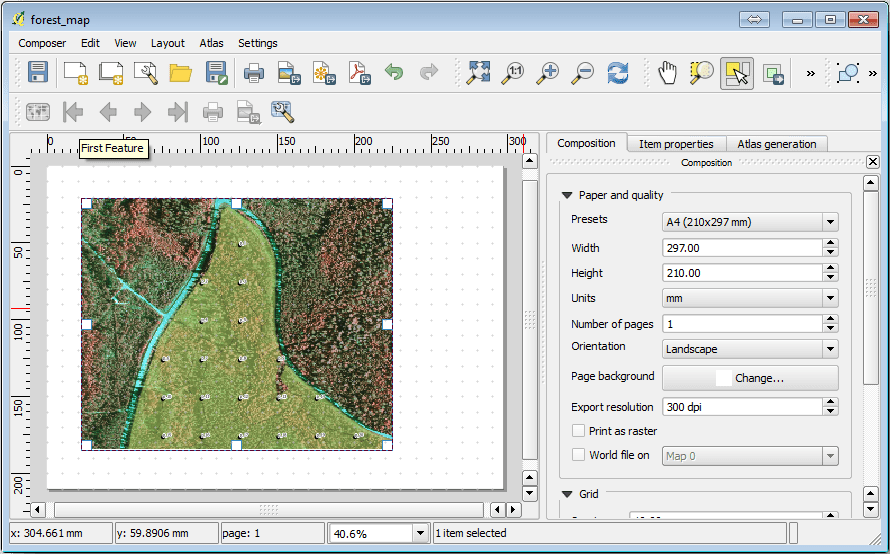
5. Print Layout Designer
The Print Layout Designer in QGIS allows for the creation of high-quality cartographic outputs. It supports adding multiple map frames, legends, scale bars, and custom text. Users can design reports, posters, and export maps in various formats (PDF, PNG, SVG). The designer supports atlas generation for batch maps based on attribute values, ideal for creating map books or individualized area maps. Customizable templates and style settings ensure visual consistency and professionalism. This tool bridges the gap between analysis and presentation, making your spatial data accessible to stakeholders.
High-resolution thematic map output using Print Layout Designer
Source: Website Link
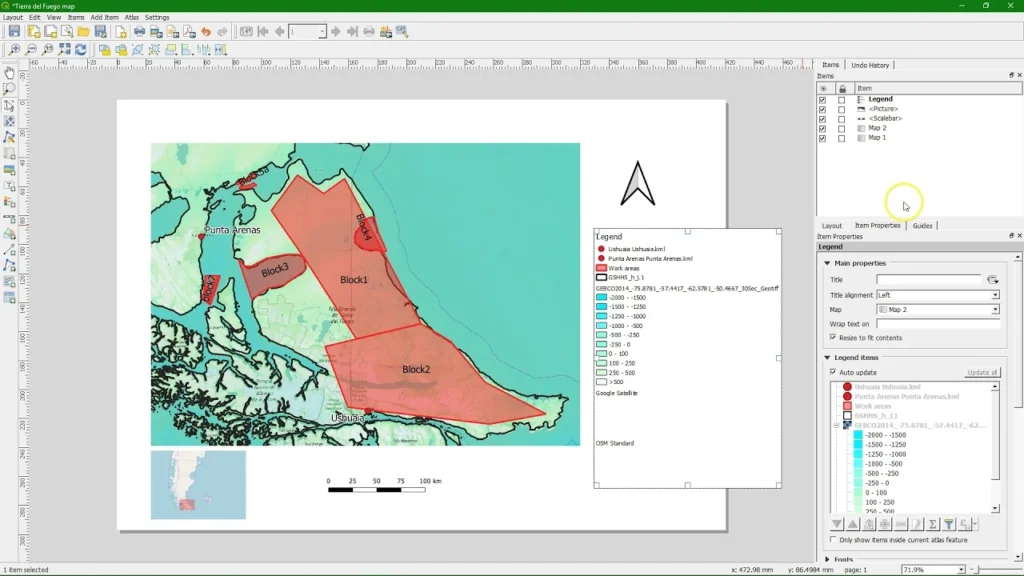
6. Atlas Generation Tool
The Atlas Generation feature in QGIS enhances the Print Layout Designer by automating the production of multiple maps. It cycles through features in a layer (like neighborhoods or wards) and creates map outputs for each. This is invaluable for projects involving zoning maps, demographic studies, or site-specific planning. Users can customize layouts per feature, adjust extents dynamically, and export maps in batches. The atlas generation saves significant time while maintaining cartographic consistency across multiple outputs.
Automated map book creation using Atlas Generator
Source: Website Link
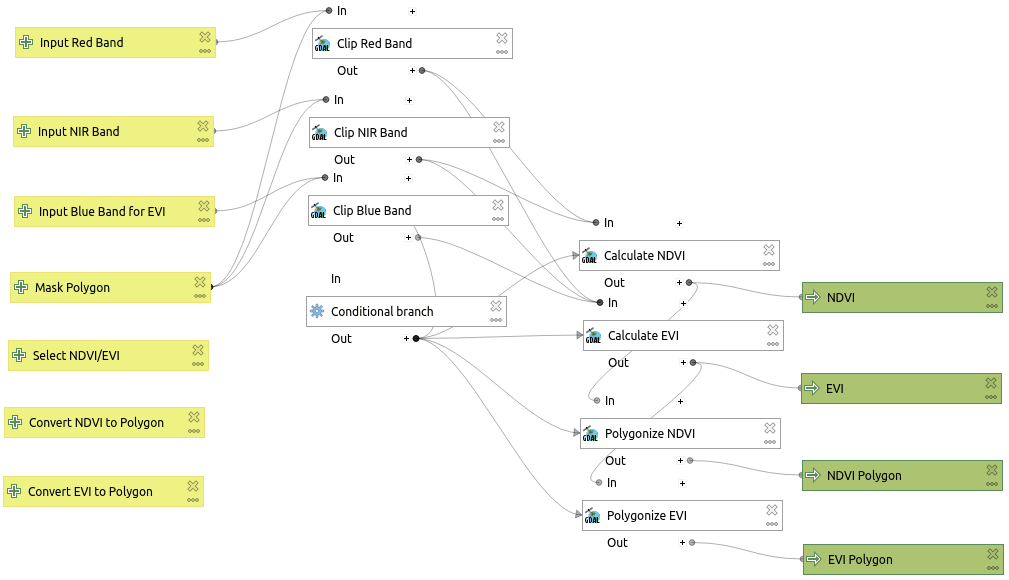
7. QGIS Model Builder
Model Builder enables users to create visual workflows by chaining together multiple processing tools. This tool allows for automating repetitive GIS tasks like clipping, reprojecting, or running complex analytical sequences. Users can define input parameters, set conditions, and reuse models across projects. The drag-and-drop interface supports documentation, making it easier to share workflows within teams. It’s ideal for standardizing procedures and ensuring data analysis consistency across departments.
Custom visual workflows built using QGIS Model Builder
Source: Website Link
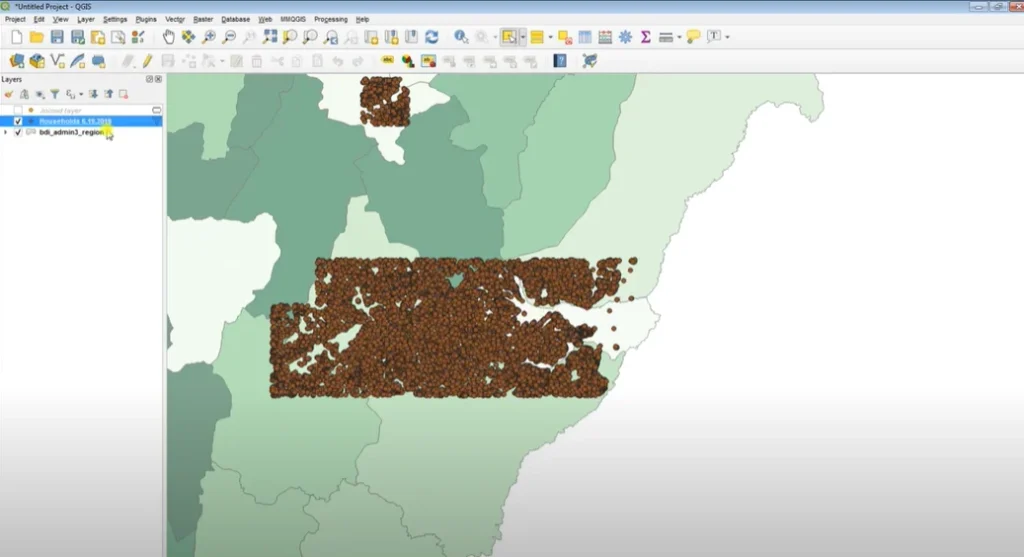
8. Join Attributes by Location
Join Attributes by Location allows the enrichment of a layer’s attribute table based on spatial relationships with another layer. For example, joining demographic data from census tracts to school locations or adding land use categories to a road network. It supports various spatial relationships intersect, contains, within, etc. and is essential for spatially-informed decision making. The tool is intuitive and offers options to keep only matching features or all features, depending on the analysis need.
Attribute enrichment based on spatial joins across layers
Source: Website Link
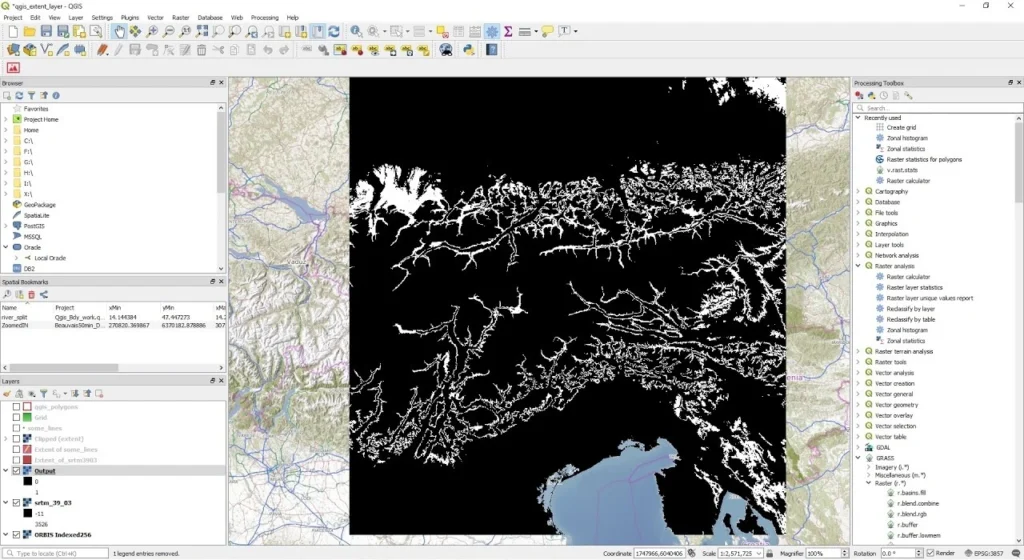
9. Raster Calculator
Raster Calculator is a powerful tool for mathematical operations on raster layers. Users can perform tasks like NDVI calculation, terrain classification, or masking based on pixel values. It supports logical expressions, conditional statements, and custom equations. It’s essential in environmental studies, agriculture, and terrain modeling where pixel-level computations are required. The calculator supports multi-layer expressions, allowing integration of various environmental factors into one analysis.
NDVI calculation using multi-band raster operations
Source: Website Link
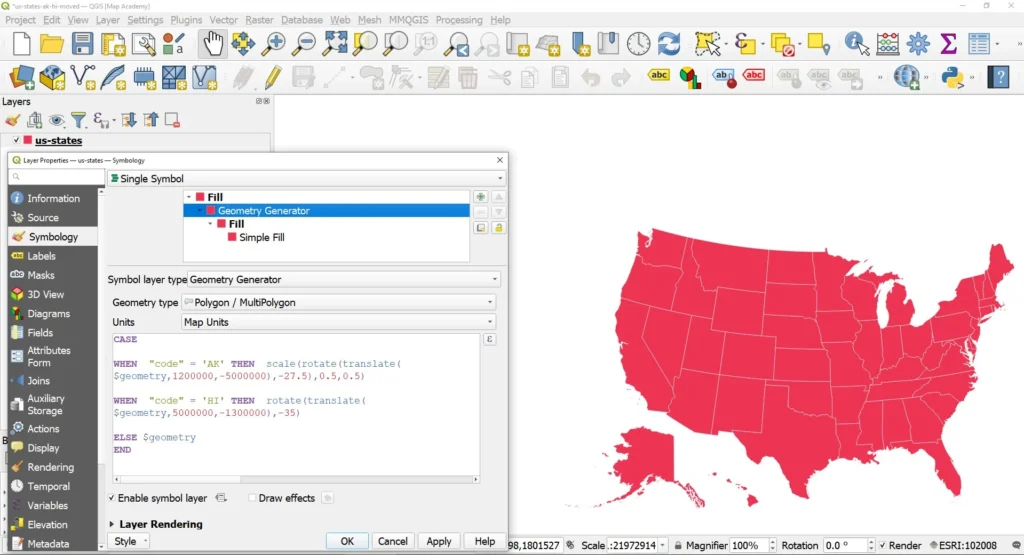
10. Geometry Generator
The Geometry Generator allows creation of dynamic geometries directly within the layer’s style settings. For example, you can visualize buffer zones, create arrows showing direction, or dynamically label distances. It supports custom expressions that draw new geometries based on existing data. This tool adds a layer of visual intelligence to spatial features without needing to alter the underlying dataset.
Dynamic symbology using geometry-based expressions
Source: Website Link
Conclusion
QGIS continues to redefine the boundaries of open-source GIS with tools that rival proprietary platforms. These ten tools empower users to conduct advanced spatial analysis, automate tasks, and produce professional outputs with ease. From temporal visualization to machine learning classification, QGIS offers a versatile platform for geospatial professionals across disciplines. As spatial data becomes increasingly central to urban design, climate planning, and infrastructure development, mastering these tools is crucial. Whether you’re a beginner or an experienced analyst, integrating these functions into your workflow can vastly improve both efficiency and insight.
With continuous community support and plugin development, QGIS remains a leading choice for spatial analysis worldwide.
References
Graser, A. (2022). Learning QGIS (5th ed.). Packt Publishing.
Smith, D., & Clark, J. (2020). GIS Fundamentals: A First Text on Geographic Information Systems (6th ed.). XanEdu.
Sherbinin, A. de, et al. (2019). Remote sensing and GIS for environmental change. Environmental Research Letters, 14(3), 034017.
QGIS Documentation Team. (2025). QGIS User Guide. Retrieved from https://docs.qgis.org
Blaschke, T. (2010). Object based image analysis for remote sensing. ISPRS Journal of Photogrammetry and Remote Sensing, 65(1), 2-16.
Tomlinson, R. (2013). Thinking about GIS: Geographic Information System Planning for Managers (5th ed.). Esri Press.
United Nations. (2022). Geospatial Practices for Sustainable Development in Africa. UN-GGIM.
Liu, X., et al. (2021). Urban land use dynamics with remote sensing and GIS. Sustainability, 13(5), 2544.
Olaya, V. (2023). Sextante: A Free Software Tool for Spatial Data Analysis. Retrieved from https://www.sextantegis.com
Lillesand, T. M., Kiefer, R. W., & Chipman, J. W. (2015). Remote Sensing and Image Interpretation (7th ed.). Wiley.
Neha Lad
About the author
Neha Lad is an urban designer with a global outlook, shaped by her postgraduate journey at the Manchester School of Architecture and hands-on project work across continents. She thrives on connecting bold ideas with on-the-ground realities, weaving research and creativity into every design narrative. Whether sketching city plans or collaborating with diverse teams, Neha brings curiosity and energy to the table believing that great cities are built through both strategy and empathy. Passionate about inclusive urbanism, participatory planning, and ethical innovation, she is committed to shaping urban spaces that are resilient, human-centred, and ready for the challenges of tomorrow.
“Let’s explore the new avenues of Urban environment together “
We use cookies on our website to give you the most relevant experience by remembering your preferences and repeat visits. By clicking “Accept”, you consent to the use of all the cookies. Read More
This website uses cookies to improve your experience while you navigate through the website. Out of these, the cookies that are categorized as necessary are stored on your browser as they are essential for the working of basic functionalities of the website. We also use third-party cookies that help us analyze and understand how you use this website. These cookies will be stored in your browser only with your consent. You also have the option to opt-out of these cookies. But opting out of some of these cookies may affect your browsing experience.
Necessary cookies are absolutely essential for the website to function properly. These cookies ensure basic functionalities and security features of the website, anonymously.
Cookie
Duration
Description
cookielawinfo-checkbox-functional
11 months
The cookie is set by GDPR cookie consent to record the user consent for the cookies in the category "Functional".
cookielawinfo-checkbox-performance
11 months
This cookie is set by GDPR Cookie Consent plugin. The cookie is used to store the user consent for the cookies in the category "Performance".
cookielawinfo-checkbox-others
11 months
This cookie is set by GDPR Cookie Consent plugin. The cookie is used to store the user consent for the cookies in the category "Other.
cookielawinfo-checkbox-analytics
11 months
This cookie is set by GDPR Cookie Consent plugin. The cookie is used to store the user consent for the cookies in the category "Analytics".
cookielawinfo-checkbox-necessary
11 months
This cookie is set by GDPR Cookie Consent plugin. The cookies is used to store the user consent for the cookies in the category "Necessary".
viewed_cookie_policy
11 months
The cookie is set by the GDPR Cookie Consent plugin and is used to store whether or not user has consented to the use of cookies. It does not store any personal data.
Functional cookies help to perform certain functionalities like sharing the content of the website on social media platforms, collect feedbacks, and other third-party features.
Performance cookies are used to understand and analyze the key performance indexes of the website which helps in delivering a better user experience for the visitors.
Analytical cookies are used to understand how visitors interact with the website. These cookies help provide information on metrics the number of visitors, bounce rate, traffic source, etc.
Advertisement cookies are used to provide visitors with relevant ads and marketing campaigns. These cookies track visitors across websites and collect information to provide customized ads.