Land Costs and Housing Costs
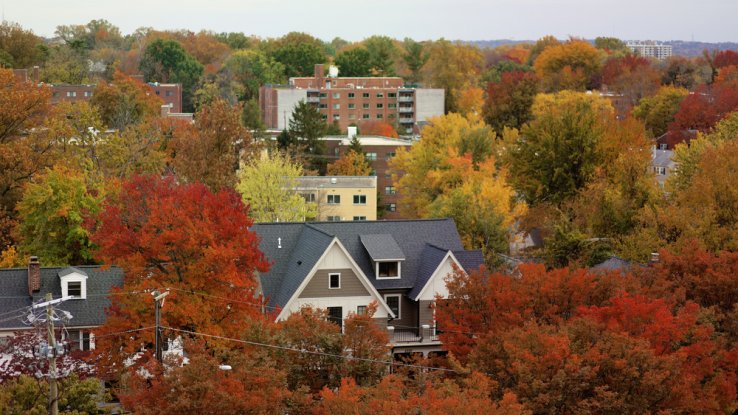
One common argument against making zoning less restrictive is that because upzoning makes land more valuable, increased land costs will cause rents to go up rather than down. Thus, this requires us to believe that 1) more building equals higher land costs; 2) higher land costs equal more rents; and 3) less building equals lower land costs.
The American Enterprise Institute has a database of land cost changes. Most fast-growing Sunbelt metros added between one and three jobs per housing unit* over the 2010s; this means that even though demand (as measured by jobs) increased faster than supply, the increase was not enormous. For example, Houston added 1.2 jobs per housing unit, and Austin added 1.5. Land costs per acre did rise quite rapidly in these metros; in Houston, for example, land costs** rose from $220,000 to $545,000 per acre between 2012 and 2019. Similarly, in Raleigh (1.4 jobs per housing unit), land costs rose from just over $151,000 to $387,000, and in Austin, land costs rose from $251,000 per acre to $715,000 per acre. Land costs rose even more rapidly in some other fast-growing metros: in Dallas and Charlotte (1.8) land costs tripled. Land costs more than tripled in Atlanta (2.5 jobs), almost quadrupled in Orlando (2 jobs) more than quadrupled in Phoenix (2.3 jobs), and more than quintupled in Las Vegas (2.3 jobs). (I note that because land costs nationwide decreased by about 50 percent during the late 2000s recession, so some of this change represents recovery from that recession.)
But if new housing was primarily to blame for high land costs, land costs would have stabilized in high-cost cities that are less willing to allow new housing. But this did not happen. In Boston (3.4 jobs per new unit), land costs more than doubled, from $633,000 per acre to just over $1.33 million per acre. In Los Angeles (4.2 per unit) land costs experienced a similar increase, from $1.779 million per acre to $3.890 million. In San Francisco (5.9) land costs increased from $2.937 million per acre to $7.18 million per acre. In San Diego (3.8) land costs increased from just over $864,000 per acre to just over $2 million per acre. New York (4.2), at first glance, appears to be something of an exception to this pattern of rising land costs: land costs only increased by about two-thirds, from $1.8 million per acre to $3 million. But in New York there was a gap between urban and suburban counties: land costs in Bronx, Brooklyn, and Queens doubled or nearly so, while land costs in some suburban counties increased more gradually.
On balance, it appears that land costs in large Sunbelt metros grew everywhere, but grew at a slightly faster rate than in New York or California; in high-cost metros, land prices often doubled, but never tripled or quadrupled. On the other hand, land cost increases were higher in raw dollars in the high-cost metros. Even in New York, land prices per acre rose by $1.2 million, far more than the Sun Belt metros listed above. Similarly, land cost increases per acre exceeded $1 million in San Francisco, San Diego, and Los Angeles, and were roughly $700,000 in Boston. Thus, one could argue that land cost increases in the more restrictive metros were actually more significant than those in Phoenix or Las Vegas. So if the question is: “did land costs rise more in the more permissive Sun Belt metros than in the more restrictive high-cost metros?” the right answer is “maybe—it depends on how you measure increases.” So it is not even clear if part one of the argument (more housing= higher land costs) is true.
But for the “new buildings increase land costs and thus increase rents” argument to be true, it is not enough for more permissive metros to have growing land costs; they must also have higher rents. Of course, this is not the case. The cost of land (or at least the cost of unimproved land) affects new housing far more than it affects older housing; the land costs of an older building do not directly affect rent because the land for those buildings were bought long ago. So rather than just looking at median city rents, I ran a Zillow.com search for housing built after 2018. In New York City, the rent for new one-bedroom apartments built after 2018 ranges from $1,350 (for a new one-bedroom near Fordham University in the Bronx) to over $13,000; however, the median was about $2850, or almost half of median household income. *** In Boston, the cheapest new apartment (except for one-seniors only community with income limits) was $2,200, and the median was $3,000, about 45 percent of median household income. In Los Angeles, there were a few low-cost new units, but the median new one-bedroom rented for almost $2,700, or about 48 percent of median household income.
How do high-growth cities compare? In Houston, rents for new one-bedrooms ranged from $850 to $2,570; half of these apartments rented for under $1700, or about 39 percent of median household income. In Austin, rents ranged from $950 to $3,395, but half rented for $1,600 or less, or about 25 percent of median household income. In Atlanta, new one-bedroom rents ranged between $1575 and $3575; however, only one of the 20 apartments listed rented for over $2,200, and the median rented for $1830, or about one-third of median household income. In other words, new apartments in low-cost/high-growth cities rent for less than new apartments in our nation’s most expensive cities.****
Having said that, 2021 is a snapshot in time: it does not tell us whether new-unit rent in (for example) Las Vegas has increased as rapidly as new-unit rent in more expensive, housing-constrained cities.
We do have some data on how rapidly all rents have risen in various cities over the past several years. A paper recently written for the Manhattan Institute shows that between 2014 and 2019, rents in all kinds of metros rose by similar percentages. For example, a look at expensive metros with very little new housing construction shows growth rates ranging from 14% (New York and its suburbs) to 36% (San Francisco). Rents in Boston and Los Angeles rose by 19% and 32% respectively). There was a similar range of growth rates in high-construction metros, from 13% (Houston) to 36% (Phoenix). Having said that, a 13 percent increase in Houston is not the same as a 13 percent increase in New York. If you are renting for $1295 (a typical 2014 rent in Houston) a 13% per month increase is roughly a $180 increase. If you are renting for $2439 (the typical 2014 rent) in New York, a similar increase is a $300 per month increase. So unless wages rose more rapidly in high-cost cities, rent increases were still more burdensome in the most expensive cities.
So on balance, it seems to me that over the long term, the anti-housing policies of regions, such as coastal California, have neither succeeded in limiting land costs nor have they succeeded in preventing housing costs from spiraling out of control. But even in more permissive places, housing costs rose to some extent during the 2010s.
*Data here.
**Land price data here.
***I found household income data at city-data.com.
****Having said that, my data for most of these cities involves fairly small sample sizes. One reason why I have not used suburban data in discussing average rents is that there is not much new rental housing in most suburbs, or at least not much that is available for rent right now.
Author:
Michael Lewyn
Michael Lewyn is an associate professor at Touro College, Jacob D. Fuchsberg Law Center, in Long Island.
Program: Urban Planning
Publisher: Planetezin
Related articles


Architecture Professional Degree Delisting: Explained
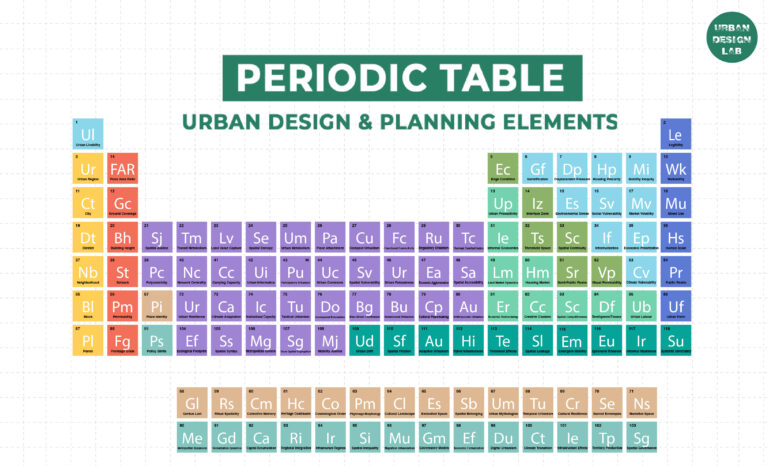
Periodic Table for Urban Design and Planning Elements


History of Urban Planning in India

Kim Dovey: Leading Theories on Informal Cities and Urban Assemblage
UDL GIS
Masterclass
GIS Made Easy – Learn to Map, Analyse, and Transform Urban Futures
Session Dates
23rd-27th February 2026

Urban Design Lab
Be the part of our Network
Stay updated on workshops, design tools, and calls for collaboration
Curating the best graduate thesis project globally!

Free E-Book
From thesis to Portfolio
A Guide to Convert Academic Work into a Professional Portfolio”
Recent Posts
- Article Posted:
- Article Posted:
- Article Posted:
- Article Posted:
- Article Posted:
- Article Posted:
- Article Posted:
- Article Posted:
- Article Posted:
- Article Posted:
- Article Posted:
- Article Posted:
Sign up for our Newsletter
“Let’s explore the new avenues of Urban environment together “


