In the age of rapid urbanization, climate vulnerability, and spatial inequity, cities demand more than intuition—they demand insight. For architects, urban designers, planners, and researchers, spatial analysis using Geographic Information Systems (GIS) is no longer a niche skill. It is a critical methodology for understanding how cities function and how design decisions impact people, infrastructure, and the environment.
Our new eBook, Spatial Analysis with GIS: Toolkit for Smarter Urban Mapping, equips professionals and students with a clear conceptual foundation in spatial thinking, thematic mapping, and geospatial reasoning. It blends design logic with data literacy—anchored in real urban challenges, open-source platforms like QGIS, and practical applications for planning, equity, and resilience.
UDL Thesis Publication | 2025
Curating the best Graduate Thesis Projects Globally!
This book is not a software manual. It’s a thinking toolkit—framing the logic of GIS for urban applications and guiding readers through essential map types and spatial strategies. Here’s what you’ll explore across six structured chapters:
1. Introduction – Why Spatial Thinking Matters
Before a designer begins to draw, or a planner begins to regulate, they must understand where they are working and how that space functions in relation to the systems around it. The first chapter of the eBook introduces spatial intelligence as the foundation of this understanding. It positions GIS not simply as software but as a framework for thinking about cities—where multiple layers of data intersect to reveal patterns, conflicts, and possibilities that are invisible to the naked eye.
You’ll explore how spatial reasoning supports multi-scalar design logic, from neighborhood walkability to regional infrastructure. It shows how thematic mapping uncovers inequities, latent connections, and planning inconsistencies. It also questions how maps are constructed, what biases they carry, and how they mediate our view of urban reality.
2. Base Maps – Contextualizing the Urban Terrain
No analysis begins in a vacuum. Before any overlay, thematic map, or spatial model, comes the base map—the geographic scaffold that anchors all other data in reality. Chapter 2 walks you through how to build and interpret base maps that represent the physical and administrative anatomy of the city.
You’ll learn what a good base map contains: roads (for connectivity), rivers and water bodies (for ecological structure), terrain (for elevation, slope, and buildability), and administrative boundaries (for governance and policy zones). You’ll also reflect on why clarity in base maps matters—especially when used as the canvas for zoning overlays, infrastructure planning, and community engagement.
3. Thematic Maps – Visualizing Urban Conditions
Beyond visual aesthetics, thematic maps are analytical instruments—tools that allow urban professionals to make sense of complex data by embedding it within geographic space. In Chapter 3 of the eBook, you’ll explore ten fundamental thematic map types, each with a distinct method for visualizing spatial patterns, distributions, and relationships.
These map types are not interchangeable. Each one has its own logic, suited for different types of variables, geographic scales, and audiences. Whether you’re illustrating demographic intensity, infrastructure accessibility, or environmental vulnerability, choosing the right thematic technique can significantly impact the accuracy, readability, and interpretability of your spatial message.
Here’s a quick overview of the ten core types you’ll explore:
Choropleth Maps – Use color gradients to show intensity within zones (e.g., population density per ward).
Graduated Symbol Maps – Represent numerical data at specific points with circles sized by magnitude.
Proportional Symbol Maps – Show exact data values through proportionally scaled point symbols.
Dot Density Maps – Use repeated dots to represent frequency or distribution (e.g., voter turnout, building permits).
Heatmaps – Visualize point intensity across space to reveal activity hotspots (e.g., vendor clusters, crime zones).
Categorical Maps – Depict distinct, non-numerical data types using different colors or patterns (e.g., land use, building typologies).
Isarithmic/Interpolation Maps – Represent continuous data surfaces like pollution, temperature, or noise.
Bivariate & Composite Maps – Combine two or more datasets to show spatial correlation (e.g., population density + green access).
Change Detection Maps – Compare spatial data over time to track urban growth, land cover shifts, or development trends.
Conflict/Overlay Maps – Highlight mismatches or intersections between regulatory frameworks and real-world conditions (e.g., zoning violations in floodplains).
UDL Thesis Publication | 2025
Curating the best Graduate Thesis Projects Globally!
4. Real-World Applications – Mapping for Policy, Design, Equity, and Decision-Making
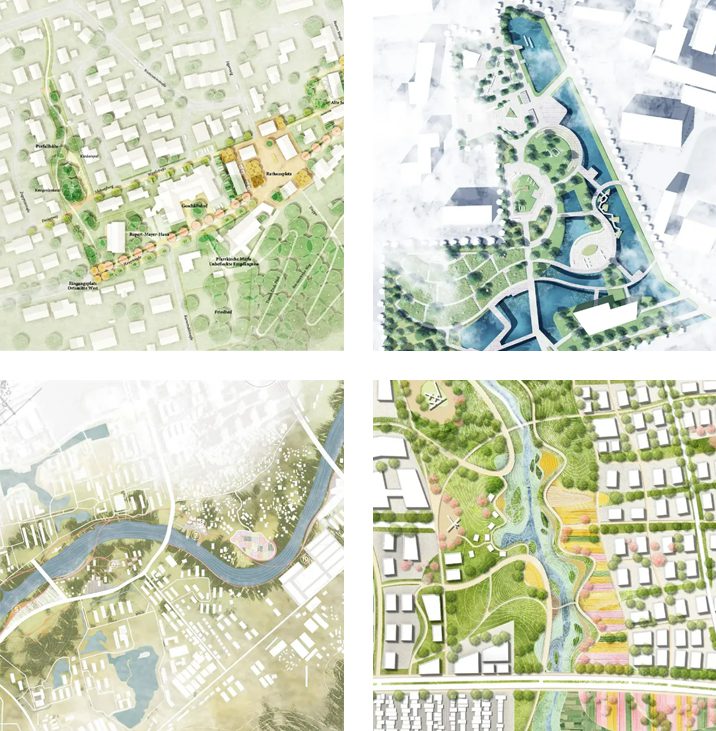
Spatial analysis is not an academic exercise—it is a tool of action. Chapter 4 explores how thematic and analytical maps are applied across real-world urban contexts, shaping decisions in governance, design, infrastructure, and community engagement.
From master planning offices to grassroots movements, maps play a central role in identifying priorities, revealing blind spots, and making complex data accessible to multiple stakeholders. A well-crafted spatial analysis can influence zoning approvals, drive investment into underserved areas, or support ecological preservation strategies. It helps professionals move from intuition to insight, from isolated observations to pattern recognition.
Whether you’re addressing informal settlements, assessing flood vulnerability, or mapping healthcare access, spatial analysis empowers you to work with evidence, clarity, and purpose. This chapter frames mapping as an operational tool—one that transforms how institutions allocate resources, how designers select sites, and how communities articulate spatial demands.
5. Building a Spatial Mindset – Toward a Culture of Data-Driven, Context-Aware Urbanism
How do urban professionals move from data to insight? This chapter explores how thinking in spatial layers enables deeper context interpretation. It also examines common pitfalls in map design and interpretation, the role of open-source tools like QGIS in democratizing spatial access, and the future of GIS in global urbanism.
6. Sources of Spatial Data for Urban Mapping
You’ll get a curated list of 40+ global open-data portals, including:
Administrative & Base Maps: OpenStreetMap, Natural Earth, GADM
Satellite & Elevation Data: NASA Earthdata, Copernicus, SRTM, ALOS
Land Use & Environmental Data: MODIS, ESA Land Cover, Global Forest Watch
Population & Demographics: WorldPop, GHSL, Gridded Population of the World
Urban Infrastructure & Policy: UN-Habitat, World Bank Open Data, Atlas of Urban Expansion
Each listing includes direct download links and suggested uses for QGIS analysis.
Get The eBook For Free!
Spatial Analysis with GIS: Toolkit for Smarter Urban Mapping is more than a guide—it’s an invitation to rethink how we engage with the urban landscape. Whether you’re decoding demographic patterns, planning resilient infrastructure, or designing equitable public spaces, this toolkit empowers you to ask better spatial questions and build smarter, data-informed solutions. We hope this eBook inspires you to integrate GIS not just into your projects—but into your practice, pedagogy, and perspective.
Thank you for this piblication. Very helpfful and creates a systematic categorization of the various urban design maps that can be used with GIS tools. Helpful as a teaching tool as well to make concepts clear.
“Let’s explore the new avenues of Urban environment together “
We use cookies on our website to give you the most relevant experience by remembering your preferences and repeat visits. By clicking “Accept”, you consent to the use of all the cookies. Read More
This website uses cookies to improve your experience while you navigate through the website. Out of these, the cookies that are categorized as necessary are stored on your browser as they are essential for the working of basic functionalities of the website. We also use third-party cookies that help us analyze and understand how you use this website. These cookies will be stored in your browser only with your consent. You also have the option to opt-out of these cookies. But opting out of some of these cookies may affect your browsing experience.
Necessary cookies are absolutely essential for the website to function properly. These cookies ensure basic functionalities and security features of the website, anonymously.
Cookie
Duration
Description
cookielawinfo-checkbox-analytics
11 months
This cookie is set by GDPR Cookie Consent plugin. The cookie is used to store the user consent for the cookies in the category "Analytics".
cookielawinfo-checkbox-functional
11 months
The cookie is set by GDPR cookie consent to record the user consent for the cookies in the category "Functional".
cookielawinfo-checkbox-necessary
11 months
This cookie is set by GDPR Cookie Consent plugin. The cookies is used to store the user consent for the cookies in the category "Necessary".
cookielawinfo-checkbox-others
11 months
This cookie is set by GDPR Cookie Consent plugin. The cookie is used to store the user consent for the cookies in the category "Other.
cookielawinfo-checkbox-performance
11 months
This cookie is set by GDPR Cookie Consent plugin. The cookie is used to store the user consent for the cookies in the category "Performance".
viewed_cookie_policy
11 months
The cookie is set by the GDPR Cookie Consent plugin and is used to store whether or not user has consented to the use of cookies. It does not store any personal data.
Functional cookies help to perform certain functionalities like sharing the content of the website on social media platforms, collect feedbacks, and other third-party features.
Performance cookies are used to understand and analyze the key performance indexes of the website which helps in delivering a better user experience for the visitors.
Analytical cookies are used to understand how visitors interact with the website. These cookies help provide information on metrics the number of visitors, bounce rate, traffic source, etc.
Advertisement cookies are used to provide visitors with relevant ads and marketing campaigns. These cookies track visitors across websites and collect information to provide customized ads.


3 Comments
عه
Thank you for this piblication. Very helpfful and creates a systematic categorization of the various urban design maps that can be used with GIS tools. Helpful as a teaching tool as well to make concepts clear.
Thank you!