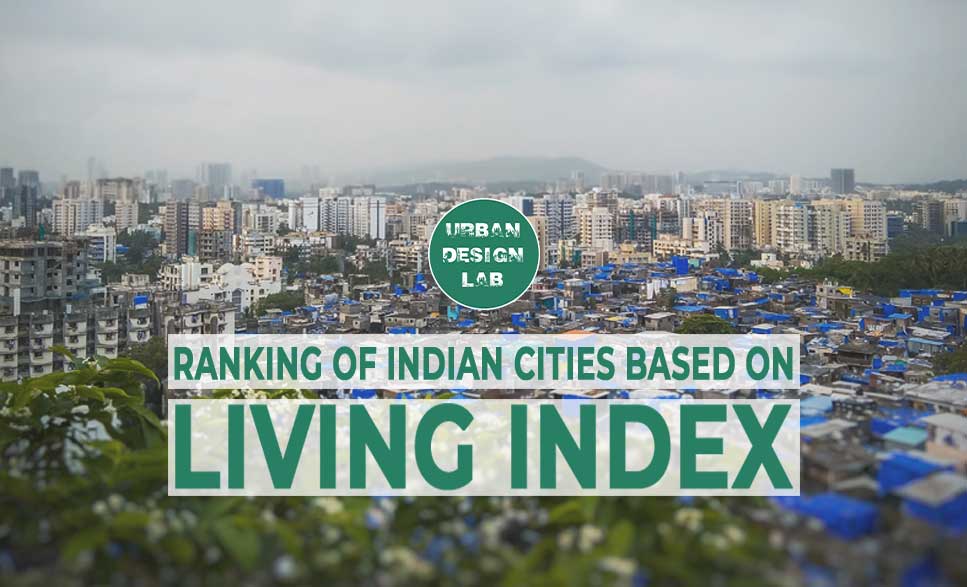
Ranking of Indian cities based on Living Index
1. Introduction
Close to 55 percent of the world population live in urban settlements. By 2045, the urban population is expected to increase 1.5 times to 6 billion, adding 2 billion more residents. The swift pace of urban expansion brings the promise of immense economic growth. It is estimated that Asia, and particularly countries like India will be at the forefront of this expansion. For Indian cities, which comprises distinct geographies and diverse communities of people, this growth also brings extensive challenges. Thus came the need for interstate migration to the best cities for citizens to lead a quality life. This in turn gave rise to the ranking system of cities to make them more livable and growing with time.
2. The Ease Of Living Index
The Ease of Living Index was developed in 2018 by the Ministry of Housing and Urban Affairs to help facilitate the evaluation of Indian cities. The Ease of Living Index 2020 presents itself as an evaluation tool that reflects the ease of living in Indian cities. The Ease of Living Index evaluates the well-being of Indian citizens in 111 cities, across various parameters that consist of four pillars: QUALITY OF LIFE, ECONOMIC ABILITY, SUSTAINABILITY, AND CITIZENS PERCEPTION SURVEY.
2.a Classification Of Cities
Cities across India show a wide variety of variations in terms of their level of development. To provide a fair comparison, cities were divided based on their population size as per the 2011 Census (figure listed below) and all cities under the Smart Cities Mission (regardless of their population size).
2.b Cross-Country Comparison
A country-level analysis provides a macroscopic understanding of the Ease of Living across Indian cities. The analysis presents the strengths and weaknesses of enabling Ease of living in India’s urban centers, which could assist in adopting sound practices and policies to improve the same.
2.c Region-Level Analysis
Furthermore, the states and union territories have been categorized under six regions for Ease of Living rankings, namely: NORTH: Chandigarh, Haryana, Jammu & Kashmir, NCT Delhi, Punjab, Rajasthan, Uttar Pradesh; SOUTH: Andhra Pradesh, Karnataka, Kerala, Lakshadweep, Puducherry, Tamil Nadu, Telangana; WEST: Dadra and Nagar Haveli, Daman and Diu, Goa, Gujarat, Maharashtra; CENTRAL: Chhattisgarh, Madhya Pradesh East: Andaman & Nicobar Islands, Bihar, jharkhand, odisha, sikkim; NORTH-EAST: Assam, Arunachal Pradesh, Manipur, Meghalaya, Mizoram, Nagaland, Tripura.
2.d Pillar-Level Analysis
2.d.i. Quality of Life
The Quality of Life pillar evaluates cities on the varied components of what is essentially a comfortable life in an urban space. While education and health are two important categories that focus on human capital formation and development and are beneficiaries of targeted policy-making, the other components that define an urban life, such as mobility, recreation, and safety.
2.d.ii. Education
The Education category evaluates cities based on eight indicators: · Household Expenditure on Education · Literacy Rate · Pupil-Teacher Ratio at the Primary Level · Pupil-Teacher Ratio at the Upper Primary Level · Dropout Rate at Secondary Level · Percentage of Schools with access to Digital Education · Percentage of Professionally Trained Teachers · National Achievement Survey Score
Access to quality and affordable healthcare has been pivotal to debates on human development, and urban areas are blessed with the capital to host health facilities. The Health category thus evaluates cities based on the following indicators: Household Expenditure on Health; Availability of Healthcare Professionals; Accredited Public Health Facilities; Availability of Hospital Beds; Prevalence of Diseases.
2.d.iv. Housing
Obtaining adequate housing is fundamental to honing an individual’s capabilities and exploring their full potential. The growth of cities is thus dependent on providing accessible housing that enables economic and social development. The Housing and Shelter category thus focuses on three indicators:· Households with electrical connections; Beneficiaries under PMAY; Slum population
2.d.v. Wash and Solid Waste Management
Cities show the scope of improvement in the WASH (Water, Sanitation and Hygiene) & Solid-Waste Management category, with the average and median category scores at 32.70 and 33.12 respectively. Vellore has attained the highest score in this category at 50.40, (high scorer in Swachh Survekshan as well). The overall category scores for these cities have been accentuated by their full coverage of households receiving piped water supply and connection to sewerage networks. Vellore’s score has further increased with its high coverage of stormwater drainage networks.
2.d.vi. Safety and Security
While most of these cities emerge from the northern parts of the country, even top-performers in the Quality of Life pillar such as Indore, Delhi, and Gurugram have recorded a high incidence of crimes against women.
Of the 13 Million+ cities that have performed below average in this high-performing category are cities such as Faridabad (84.42), Indore (83.36), Gwalior (82.04), Delhi (79.36), Vasai Virar (77.26), Raipur (76.49), Ranchi (71.88), Guwahati (71.09), Meerut (69.52) and Bareilly (69.47). Among Less than Million cities, Gurugram (82.61), Kochi (83.36), Bhubaneswar (85.91) have also scores below the national average.
2.d.vii. Mobility
Urban mobility emerges as one of the greatest challenges to urbanization. With growing resources and population, the need for expansion in transportation services arises. The prevalent modes of transportation vary across Indian cities in terms of public and private, but are commonly united in their motorized nature. To understand the mobility standards in Indian cities, the Mobility category has three indicators, namely: · Availability of public transport; Transport-related fatalities; Road infrastructure
2.d.viii. Recreation
Recreation is the poorest performing category with an average score of 11.68. Many cities have fallen short in providing open spaces for public use, and lack of entertainment and cultural centers, which have visibly brought down the overall category scores.
2.d.ix. Economic Ability
Economic Ability is the worst performing amongst all the pillars, with an aggregate score of 13.17. Bengaluru has secured the highest score at 78.82, followed by Delhi (50.73), Pune (48.88), and Ahmedabad (48.19)- all of which are Million+ cities. There are two categories to the Economic Ability pillar- Level of Economic Development, and Economic Opportunities.
2.d.x. Sustainability
This pillar evaluates Sustainability in cities through four categories of Environment, Green Spaces and Buildings, City Resilience, and Energy Consumption. Here, Pune scores highest in million+ cities and Karnal scores highest in the non million+ cities.
3. Sdg Urban Index And Dashboard
SDG Urban Index and dashboard, a robust SDG monitoring system in our cities, is a milestone step in our SDG localisation journey. Top 10 Urban areas in SDG Urban Index and Dashboard 2021-22 are Shimla, Coimbatore, Chandigarh, Thiruvananthapuram, Kochi, Panaji, Pune, Tiruchirapalli, Ahmedabad and Nagpur.
4. India Cities Happiness Report
In the first-ever India Happiness Report 2020, Mizoram has been named as the happiest state in the country. The three key takeaways for governments, organisations, and individuals are, first, different cities/states are at different levels of happiness rankings. There is a pressing need for more discussion, focus, and the application of happiness in the Indian context. Second, knowing is not enough, happiness needs to be practised. Third, choose and put into practice all or some or at least one of the insights from this report.
5. Conclusion
5.a. Achieving Sustainable Development Goals at City Level:
One of the key objectives of this report is to stimulate and fulfil the outcomes of sustainable development goals. Through a commitment of “leaving no one behind”, the SDGs aim to achieve their targets by 2030. by eliminating poverty, ensuring good health and wellbeing, gender equality, clean water and sanitation, economic growth, and sustainable cities and communities. This approach calls for optimal utilisation of resources by recognising the interdependencies between water, energy, agriculture, and food, instead of limiting these resources into sectoral management without any coordination.
5.b. Local Initiatives for locally defined problems:
Given the complexity of urban areas and the factors that shape its existence- political economy, Local solutions to locally defined issues prove to be more successful when it generates a supportive environment from local actors and community stakeholders. A diverse range of indicators and findings that arrive at varying strengths and weaknesses for each city indicates a need for implementing specific programs, unique to each city.
And in this case, it becomes increasingly important to aid and guide local administration through data-driven information that identifies key issues and facilitates better reforms. However, the Ease of Living in such cities remains unequal compared to other Indian cities, particularly those in eastern and northeastern regions.
References
https://livabilitystore175634-prod.s3.amazonaws.com/public/docs/Ease_of_Living_Report.pdf
http://social.niti.gov.in/hlt-ranking
utm_source=contentofinterest&utm_medium=text&utm_campaign=cppst
https://www.weforum.org/agenda/2019/06/water-scarcity-refugee-crisis-tech-solve-it/
https://pib.gov.in/PressReleseDetailm.aspx?PRID=1774225
https://www.jatinverma.org/sdg-urban-index-shimla-coimbatore-chandigarh-on-top
https://edtimes.in/in-pics-in-mizoram-shops-are-run-without-shopkeepers-on-humanitarian-grounds/
About the Author
Anubhav Borgohain is an architect/urban designer working in the field of urban research, specializing in resilience urbanism. He has recently worked on the ‘Rising water, Safer Shores, the BReUCom project with the Faculty of Geo-Information Science and Earth Observation- ITC University of Twente, focusing on dissemination of urban flooding preparedness through game development. Apart from research, his other interests lie in digital art making, bird-watching and farming.
Related articles


10 ways to identify Socio-Ecological Heritage in India

Metaverse and the shifting notions of public spaces
5-Days UDL GIS
Masterclass
GIS Made Easy – Learn to Map, Analyse, and Transform Urban Futures
Session Dates
14th-18th July 2025

Free E-Book
From thesis to Portfolio
A Guide to Convert Academic Work into a Professional Portfolio”
Recent Posts
- Article Posted:
- Article Posted:
- Article Posted:
- Article Posted:
- Article Posted:
- Article Posted:
- Article Posted:
- Article Posted:
- Article Posted:
- Article Posted:
- Article Posted:
- Article Posted:
Sign up for our Newsletter
“Let’s explore the new avenues of Urban environment together “


