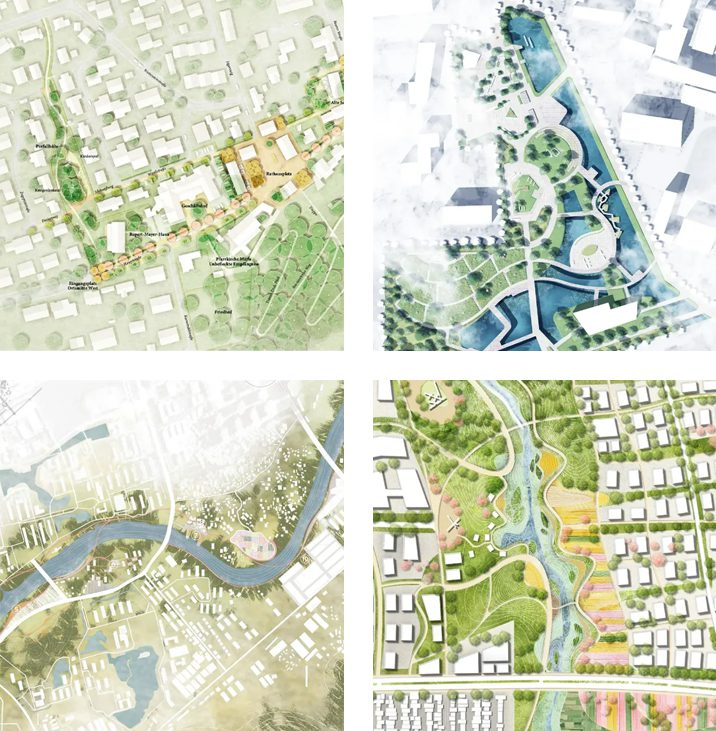
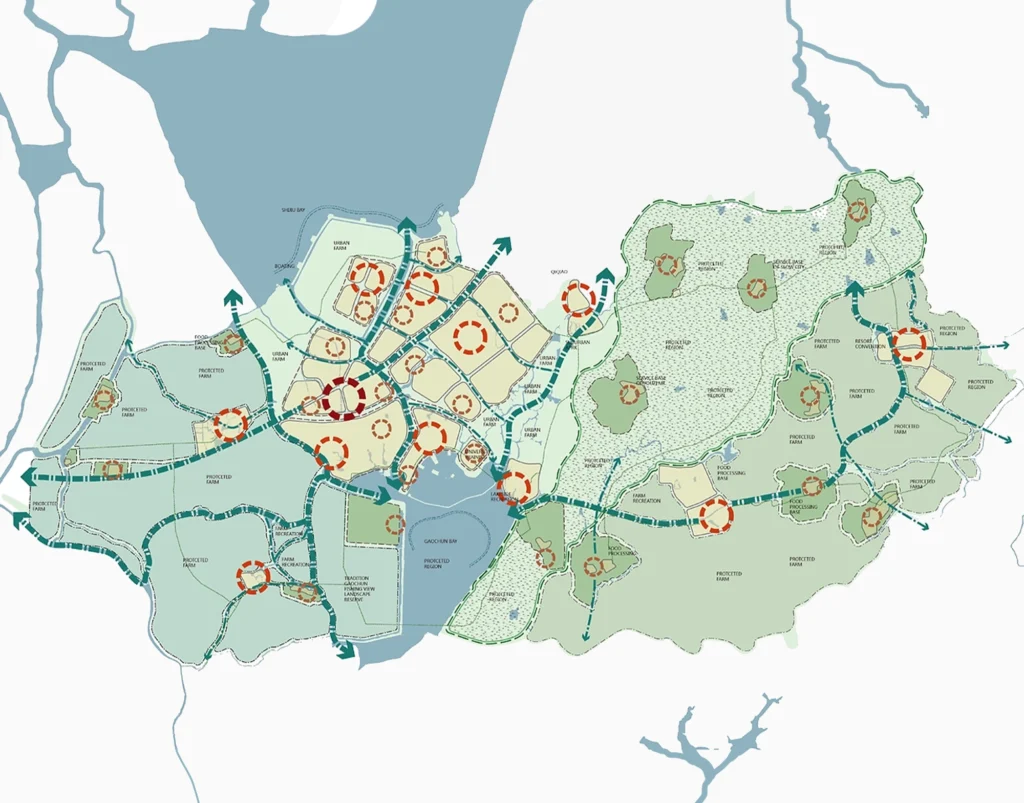
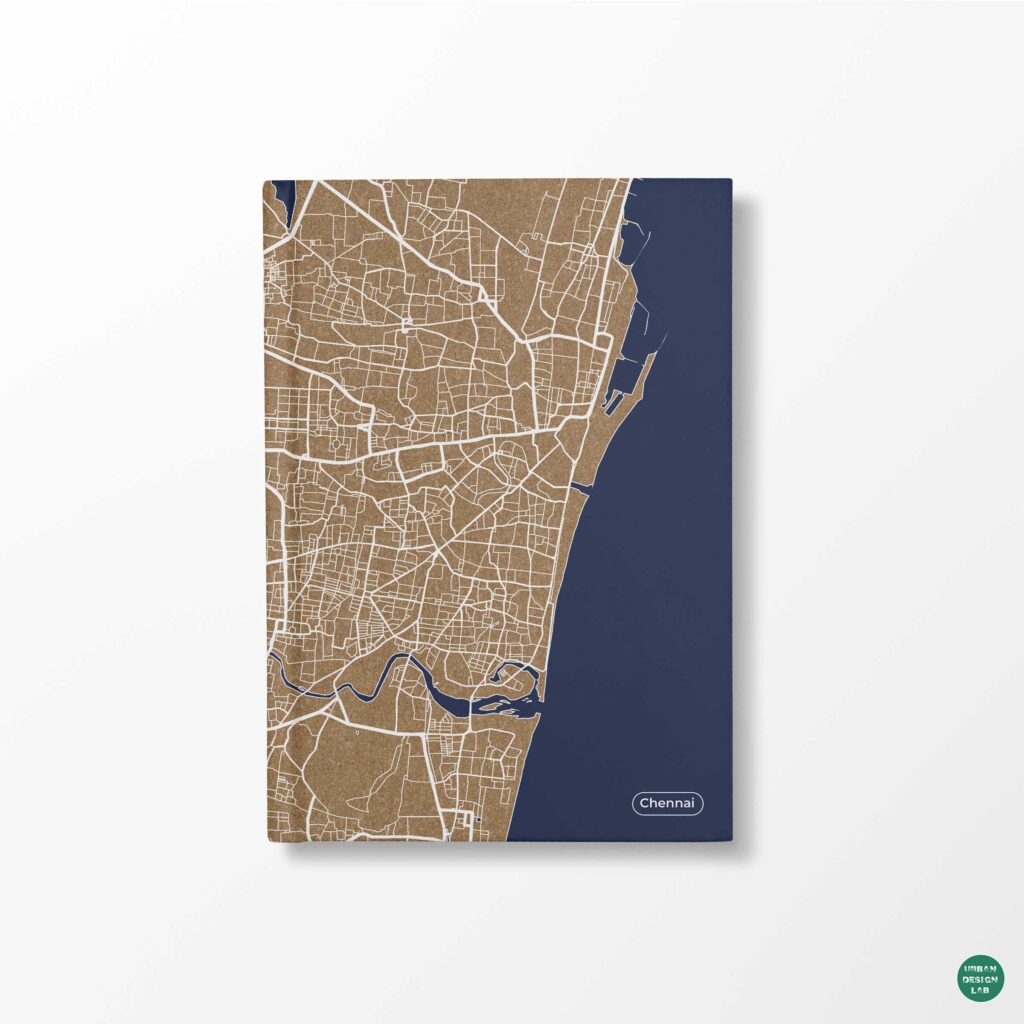
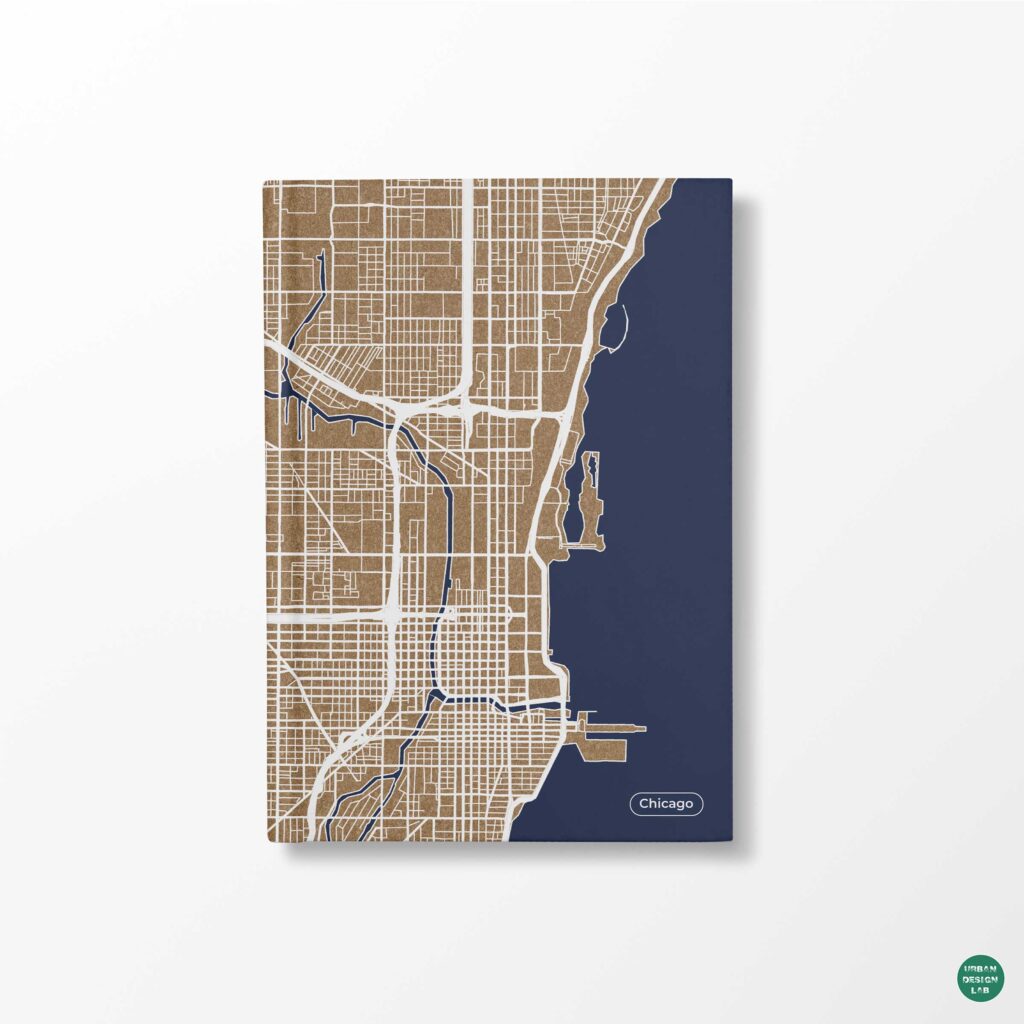
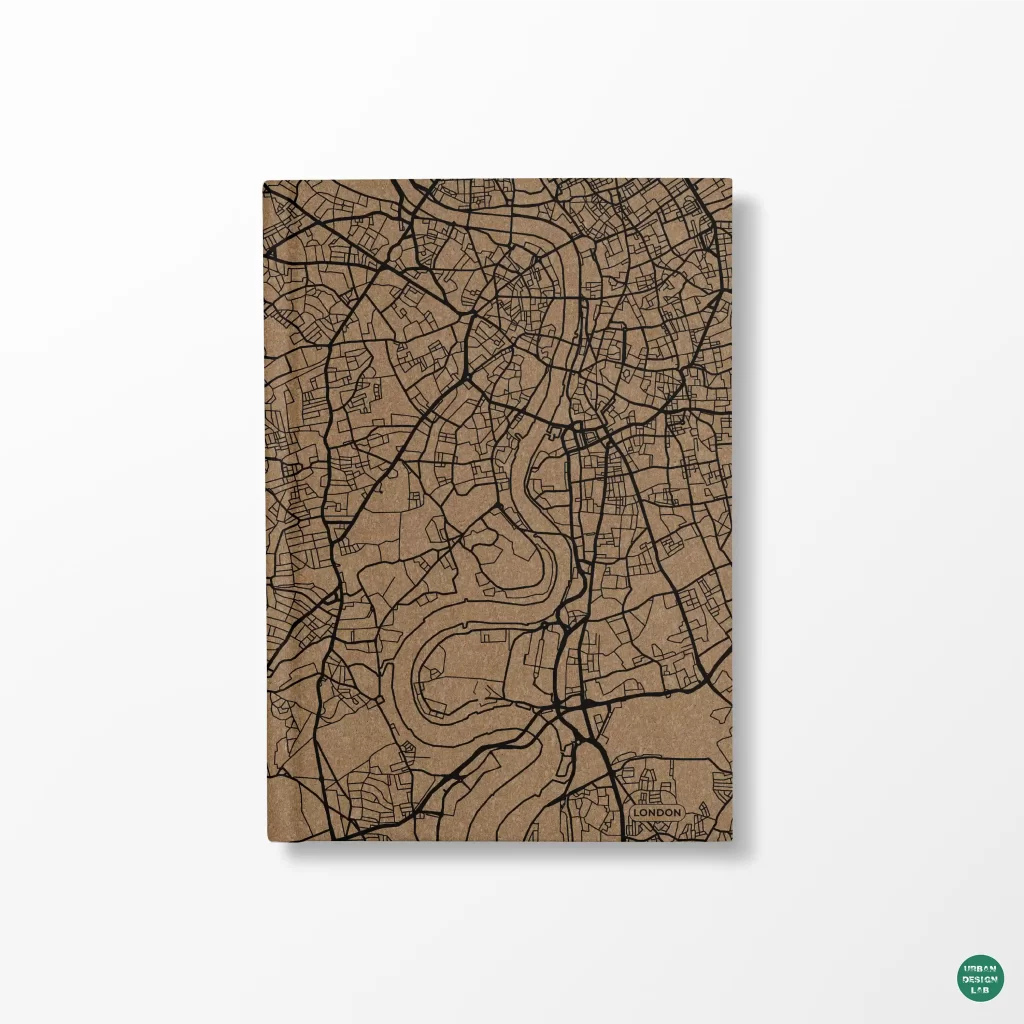
Photoshop is frequently introduced into urban mapping at the last minute, after a GIS export already contains every road, building and contour. That approach makes the application an emergency colour-correction tool and often produces a fragile collection of duplicated raster layers. A stronger workflow treats Photoshop as a controlled environment for tonal interpretation, image compositing and editorial emphasis. Its value is not that a map can be made to look like an architectural competition sheet. Its value is that complex visual material can be adjusted selectively while geographic meaning and analytical provenance remain visible.
The division of labour is important. QGIS and other geographic information systems remain responsible for coordinate reference systems, attribute calculations, joins, raster processing and defensible classification. QGIS Print Layout can assemble and export the map, including vector formats where appropriate (QGIS print layout documentation). Photoshop is most effective when the resulting composition needs atmospheric imagery, terrain treatment, masked emphasis or different publication variants. Adobe documents adjustment layers, Smart Objects and Smart Filters as mechanisms for non-destructive revision (Adobe adjustment-layer documentation) (Adobe Smart Object documentation).
The ten techniques below are organised around a single proposition: a useful graphic effect should preserve the viewer’s ability to distinguish mapped observation from visual interpretation. Each technique describes its best use, a reproducible working method and the mistake most likely to weaken the map.
Techniques 1 and 2: preserve the base map before editing it
1. Place the GIS export as a Smart Object
Instead of opening a PNG and drawing directly onto its only layer, create the Photoshop document at the intended output dimensions, then use File > Place Embedded or Place Linked for the base export. An embedded Smart Object allows its content to be transformed and revisited without repeatedly resampling the original layer; Adobe also documents the use of Illustrator or PDF artwork as Smart Objects (Adobe Smart Object documentation). Keep the original geospatial output separately, with an informative file name recording study area, map purpose and export version. The placed layer is a representation, not a substitute for the GIS project.
This matters when a design jury asks for a different crop or a publication editor needs a new page ratio. Transforming a Smart Object can be preferable to making successive edits to a flattened raster, but it does not create detail absent from the original. If road lines were rasterised at inadequate resolution, enlargement will expose their weakness. The more defensible solution is to re-export at the required scale from the GIS layout. A Smart Object is therefore a revision strategy, not a remedy for deficient source material.
2. Build a semantic layer structure and use layer comps
A typical urban map has several conceptual systems: built fabric, mobility, open space, hydrology, terrain, labels and proposed interventions. Group Photoshop layers by those meanings rather than by import order. Use descriptive group names, distinguish existing features from proposals and keep the source-based map separate from decorative treatments. Adobe’s Layer Comps can capture different combinations of layer visibility, position and appearance, making them suitable for map variants presented to different audiences (Adobe layer-comp documentation).
Imagine preparing a precinct study with one figure about pedestrian circulation and another about street-tree continuity. The same underlying map can support both if the analytical overlays are stored independently and each variation is recorded. The danger is creating visual variants that quietly change measurement periods, geographic extents or class boundaries. Use layer comps for communicative alternatives, not for mixing incompatible datasets. When updating the underlying GIS export, inspect every version and re-confirm that its source and legend still describe the visible evidence.
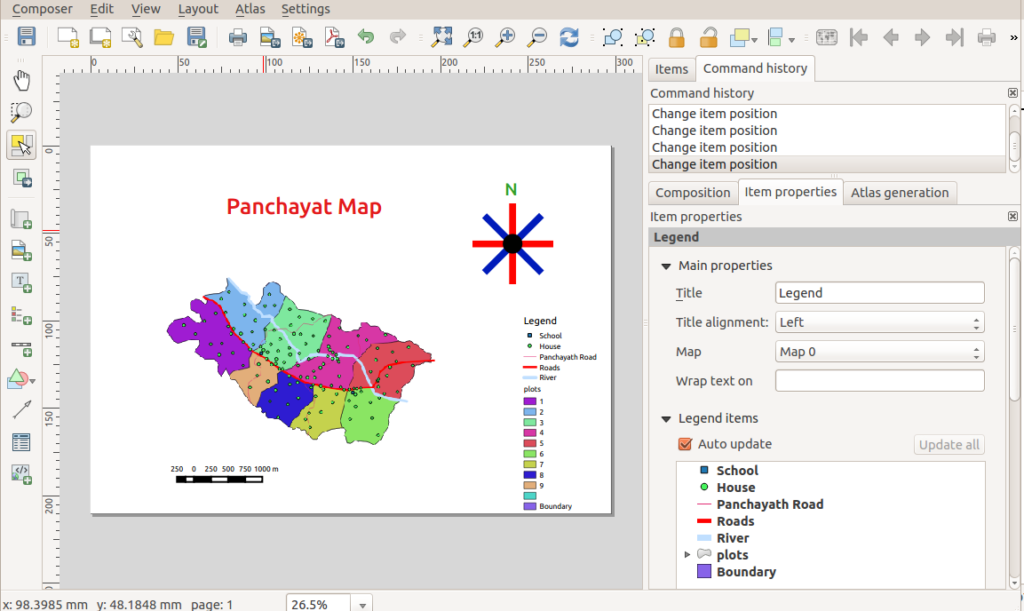
Keep a traceable cartographic baseline before beginning image-based finishing. Image: Path slopu, CC BY-SA 4.0, via Wikimedia Commons.
Techniques 3 and 4: direct emphasis without altering geometry
3. Use layer masks to isolate the study area
A layer mask lets the author hide surrounding areas without deleting pixels. Adobe describes the mask convention directly: white reveals, black conceals and grey produces partial transparency (Adobe layer-mask documentation). For a heritage precinct or a redevelopment boundary, place a subtle desaturated context layer above or below the principal map, then mask it so the study area remains legible. The effect can make boundaries easier to read than adding a thick ornamental outline, particularly when the precinct includes irregular street edges or an open landscape interface.
The mask should never conceal relevant geographic context merely to intensify a conclusion. In a pedestrian accessibility map, removing a railway barrier, river crossing or major distributor road could make the subject appear more connected than it is. Establish the editorial purpose first: the mask may reduce clutter, but the reader should retain enough context to understand the relationships at issue. If the frame becomes a selective close-up, identify it as such through the title, locator map or source note.
4. Clip tonal adjustments to particular map systems
Clipped adjustment layers allow a correction to affect only the layer directly beneath it. Adobe documents this selective workflow for Hue/Saturation, Curves and other adjustments, enabling independent control of components (Adobe adjustment-layer documentation). In practical terms, terrain shading can be darkened without making labels darker; satellite imagery can be desaturated without dulling a transit route; vegetation can be shifted in tone without changing building footprints. A clear naming convention such as “terrain / curves” makes the scope of each correction inspectable.
This technique is especially useful when a map contains imagery and data together. Atmospheric images tend to have irregular tonal ranges that compete with vector features. Instead of applying a universal filter, isolate the imagery and adjust its contrast locally. Clipping does not guarantee analytical honesty: if a categorical land-cover map has defined colours in its legend, independently changing only some category areas may destroy that correspondence. Apply selective corrections to supporting imagery and styling, while preserving the values encoded by thematic classes.
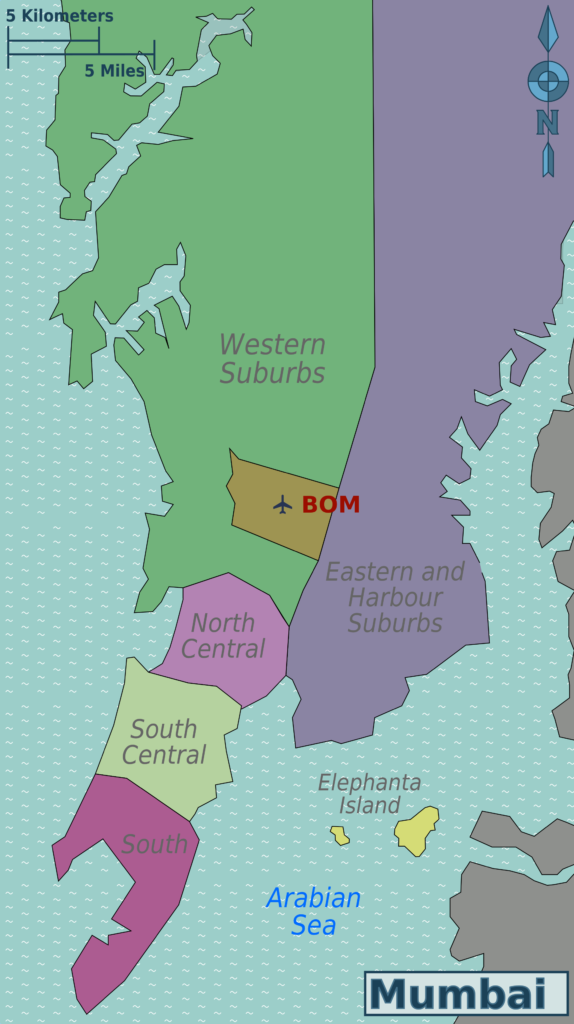
Masking can direct attention, but geographic silhouettes must remain consistent with the source. Image: Saqib Qayyum (original), Sbb1413 (derived work), CC BY-SA 3.0, via Wikimedia Commons.
Techniques 5 and 6: control contrast and colour with analytical purpose
5. Shape tonal hierarchy with Curves or Levels
Curves and Levels provide nuanced control over dark, middle and light tones using adjustment layers that can be edited later (Adobe colour-and-tone documentation). When a base map includes aerial photography, a moderate increase in midtone separation may make urban blocks distinguishable without requiring heavy outlines. In a terrain image, reducing contrast behind annotation may improve the legibility of settlement labels. These decisions are analogous to cartographic figure-ground organisation: the image substrate should support the information being emphasised, not rival it (Esri cartography guidance).
A useful diagnostic is to turn on the adjusted layer and ask whether the viewer can more easily locate the network, public space or landform being discussed. Avoid extreme contrast adjustments that turn shadows into apparent boundaries. A darkened building shadow is not necessarily a mapped building footprint; a high-contrast slope cannot demonstrate a steeper gradient unless the underlying elevation data are analysed separately. Retain the original image for comparison and describe any illustrative terrain treatment as a visual aid rather than a new geographic measurement.
6. Use Hue/Saturation and selective colour for consistency
Urban drawings frequently combine several data sources with incompatible palettes. An aerial photograph, a shaded-relief raster, a land-use layer and a diagram of selected routes may all pull attention in different directions. Photoshop’s Hue/Saturation and Selective Color adjustments can bring the supporting layers into a coherent tonal family, and adjustment layers preserve the ability to revise these decisions (Adobe adjustment-layer documentation). This is often more effective than applying an overall colour filter across the entire composition.
Do not recolour a quantitative map solely to match a brand identity. Colour is part of the evidence when a continuous ramp communicates density or a categorical palette distinguishes land uses. The Office for National Statistics recommends sequential and diverging schemes according to the variable and warns against excessive or poorly distinguished colours (ONS choropleth guidance). Make the thematic palette first, then adapt the background imagery, labels and graphic accents around it. A restrained overall appearance is useful only if it makes the classification easier, not harder, to decipher.
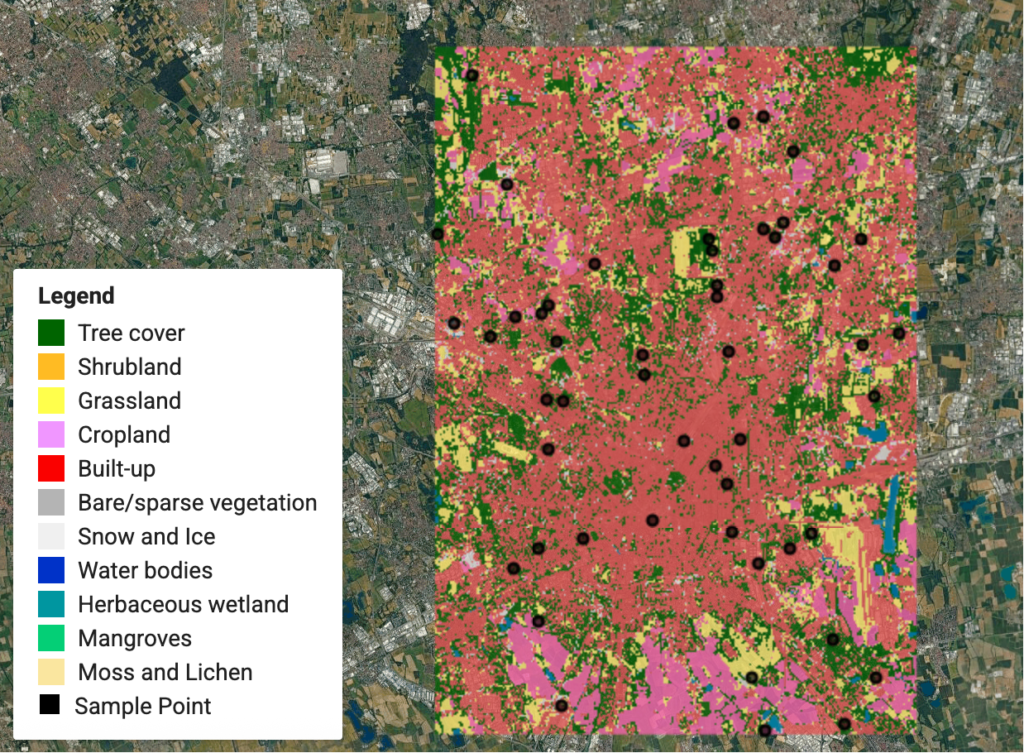
Colour adjustments should preserve the categorical distinction between mapped classes. Image: Qiongjx, CC BY-SA 4.0, via Wikimedia Commons.
Techniques 7 and 8: integrate terrain and imagery without overwhelming the data
7. Apply gradient maps to a terrain or greyscale substrate
A Gradient Map adjustment translates tonal values into a chosen sequence of colours. Adobe lists gradient maps among Photoshop’s tonal adjustment options (Adobe adjustment-layer documentation). Applied to an appropriately prepared greyscale terrain raster, the method can produce a controlled background that maintains a coherent relationship between light and dark areas. Its use should be described carefully: a gradient map of hillshade maps brightness to colour, not elevation to colour. If the graphic is intended to depict elevation bands, classify the elevation raster in GIS and provide a legitimate value legend.
For example, an urban fringe study may use subdued relief to describe a settlement’s relationship with hills, drainage and major corridors. A moderate tonal palette can give geographic depth without implying topographic precision. Keep roads and analytic overlays on separate layers. Compare the finished image with an unstyled reference, checking whether valley lines, coastlines or major ridges remain visible. If the treatment turns every shaded slope into a dramatic feature, it is no longer serving the cartographic argument.
8. Blend hillshade, textures and image layers deliberately
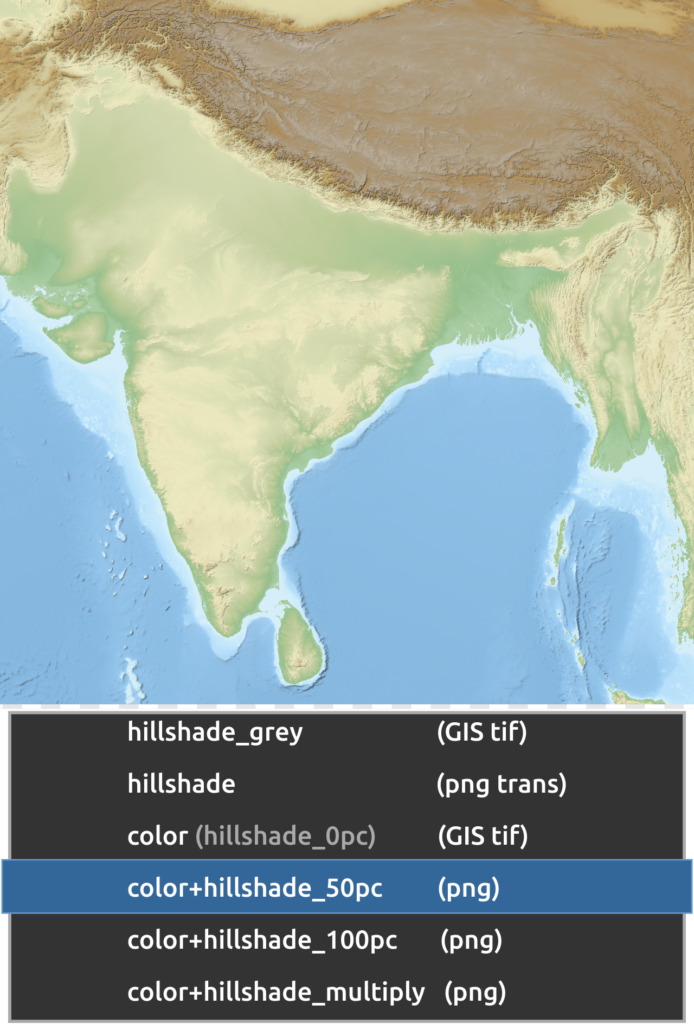
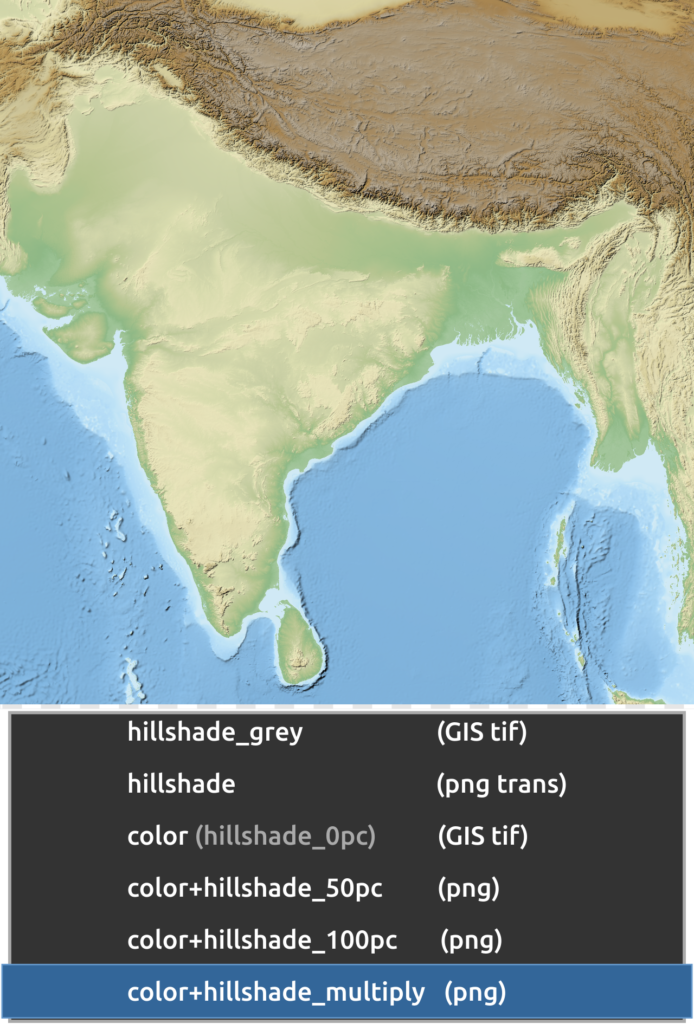
Photoshop blending modes determine how the values in one layer interact with those below, while opacity controls the strength of the composite (Adobe blending-mode documentation). Multiply is commonly useful for darker terrain shading over a light base; Screen can lighten a layer, and Normal provides a predictable starting point. The result depends on the source image and colour space, so there is no defensible universal opacity percentage. Experiment on a duplicate, inspect features at final page size and document the choice where the treatment is methodologically relevant.
The critical limitation is perceptual. Overlaying textures can improve visual continuity but can also change how readers interpret mapped categories. If a dark hillshade is placed over a choropleth, a region may look as though it belongs to a higher class merely because its terrain is shaded. It is safer to blend a relief layer under a limited-opacity base that preserves the data colours, or to separate the relief into an accompanying map. Any blended figure should be tested against the unblended data image.
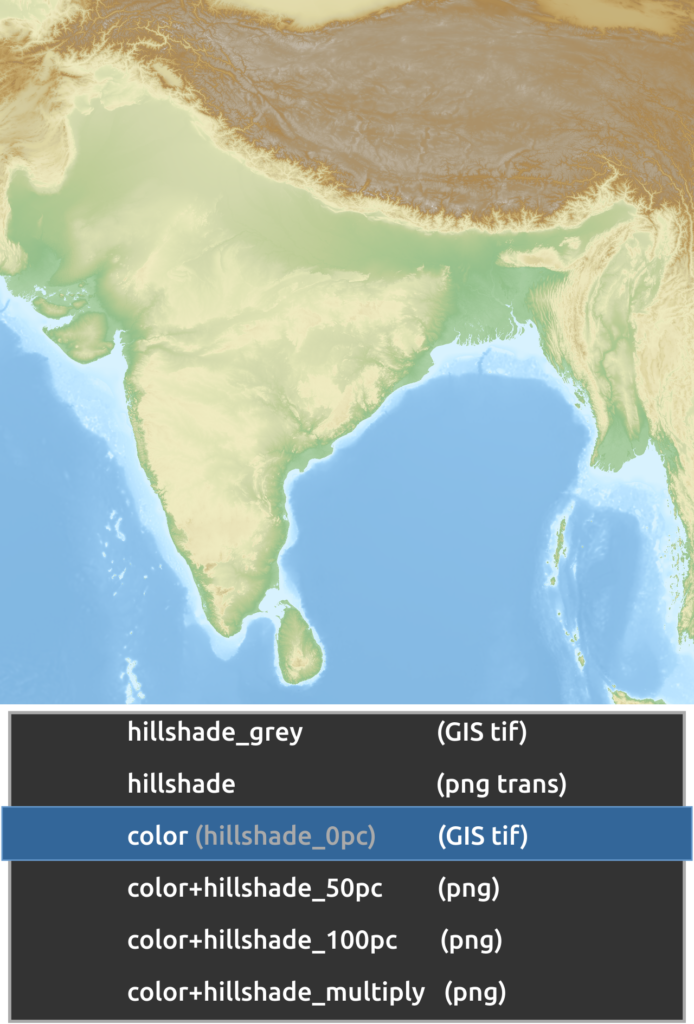
The unshaded relief artwork provides a baseline for controlled terrain-compositing decisions. Image: Yug, CC BY-SA 3.0, via Wikimedia Commons.
Techniques 9 and 10: finish for the actual publication context
9. Sharpen selectively and non-destructively
A map exported for print or web display can look soft because of raster resampling, but global sharpening may create halos around labels and building edges. Adobe documents Smart Filters as editable effects applied to Smart Objects, with separate visibility and masking controls (Adobe Smart Filters documentation). A restrained sharpening filter may be appropriate for an aerial photograph or terrain image. Mask it out of annotation, linework and categorical fills unless those components genuinely benefit from it. Evaluate the result at 100 per cent and at the intended display size.
Sharpening should not be confused with recovering detail. An aerial image whose original ground sample distance is coarse remains coarse after sharpening, and a map with too many tiny features will not become clear merely through edge enhancement. The correct response may be cartographic generalisation in GIS, larger labels or a better source raster. The USGS describes generalisation as a scale-dependent process of choosing an appropriate level of map detail (USGS cartographic representation). Use filters to refine a sound composition, never to compensate for unresolved hierarchy.
10. Export with an explicit size, profile and quality check
The final Photoshop file is not the final map. Define a target artboard or canvas size, export an appropriate image format and inspect it in its actual destination, whether WordPress, a journal submission system or a printed board. Check that text remains readable, symbols are distinguishable and transparent regions behave as intended. For WordPress publication, a compressed raster image may be operationally convenient; for high-resolution print, preserve a high-quality master and avoid repeated lossy recompression. Adobe distinguishes non-destructive working files from flattened formats such as JPEG (Adobe Smart Object documentation).
Export quality is also about traceability. The published image should carry a title, study area, legend, source and measurement date where those are needed for interpretation. Preserve an editable layered master, the original GIS export and a clear file version. Open the exported image rather than judging only the Photoshop canvas, since colour appearance, reduction and compositing can change in downstream software. This last inspection is not cosmetic housekeeping; it is the point at which the author checks whether the intended evidence survived the production chain.
A moderate relief overlay can make topography legible without overwhelming reference information. Image: Yug, CC BY-SA 3.0, via Wikimedia Commons.
Conclusion
Photoshop can substantially improve the presentation of urban mapping, but its strongest techniques are selective and reversible. Smart Objects protect working content; layer masks and clipped adjustments isolate editorial decisions; Curves, gradient maps and blending modes make supportive imagery legible; Smart Filters and controlled export complete the workflow. None of them changes the source data’s validity. A convincing urban map uses image editing to clarify measured patterns, while retaining a clear boundary between geographic evidence and illustrative treatment. The analytical work remains in GIS; the finishing work makes that analysis easier to read and evaluate.
A reference relief composition makes it easier to evaluate whether final image effects remain purposeful. Image: Yug, CC BY-SA 3.0, via Wikimedia Commons.
“Let’s explore the new avenues of Urban environment together “
We use cookies on our website to give you the most relevant experience by remembering your preferences and repeat visits. By clicking “Accept”, you consent to the use of all the cookies. Read More
This website uses cookies to improve your experience while you navigate through the website. Out of these, the cookies that are categorized as necessary are stored on your browser as they are essential for the working of basic functionalities of the website. We also use third-party cookies that help us analyze and understand how you use this website. These cookies will be stored in your browser only with your consent. You also have the option to opt-out of these cookies. But opting out of some of these cookies may affect your browsing experience.
Necessary cookies are absolutely essential for the website to function properly. These cookies ensure basic functionalities and security features of the website, anonymously.
Cookie
Duration
Description
cookielawinfo-checkbox-analytics
11 months
This cookie is set by GDPR Cookie Consent plugin. The cookie is used to store the user consent for the cookies in the category "Analytics".
cookielawinfo-checkbox-functional
11 months
The cookie is set by GDPR cookie consent to record the user consent for the cookies in the category "Functional".
cookielawinfo-checkbox-necessary
11 months
This cookie is set by GDPR Cookie Consent plugin. The cookies is used to store the user consent for the cookies in the category "Necessary".
cookielawinfo-checkbox-others
11 months
This cookie is set by GDPR Cookie Consent plugin. The cookie is used to store the user consent for the cookies in the category "Other.
cookielawinfo-checkbox-performance
11 months
This cookie is set by GDPR Cookie Consent plugin. The cookie is used to store the user consent for the cookies in the category "Performance".
viewed_cookie_policy
11 months
The cookie is set by the GDPR Cookie Consent plugin and is used to store whether or not user has consented to the use of cookies. It does not store any personal data.
Functional cookies help to perform certain functionalities like sharing the content of the website on social media platforms, collect feedbacks, and other third-party features.
Performance cookies are used to understand and analyze the key performance indexes of the website which helps in delivering a better user experience for the visitors.
Analytical cookies are used to understand how visitors interact with the website. These cookies help provide information on metrics the number of visitors, bounce rate, traffic source, etc.
Advertisement cookies are used to provide visitors with relevant ads and marketing campaigns. These cookies track visitors across websites and collect information to provide customized ads.