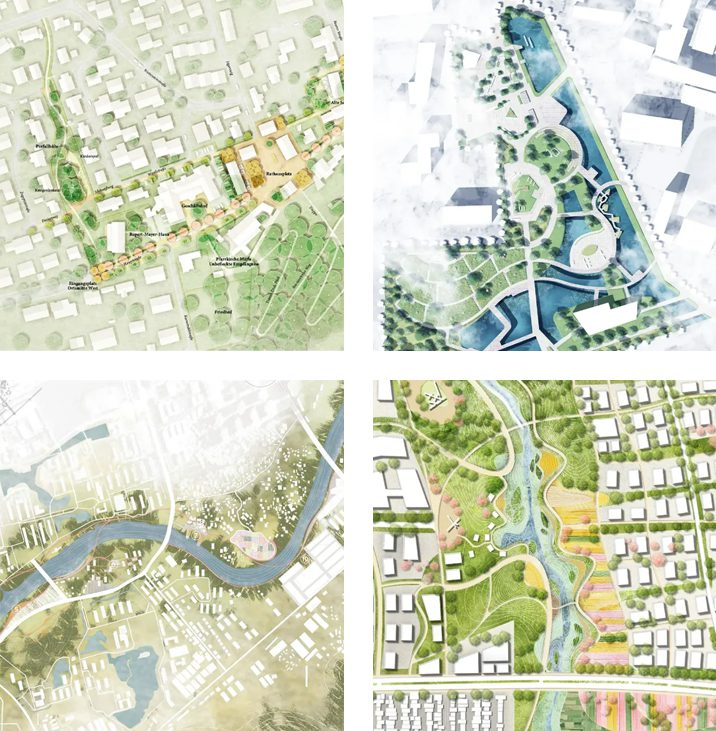
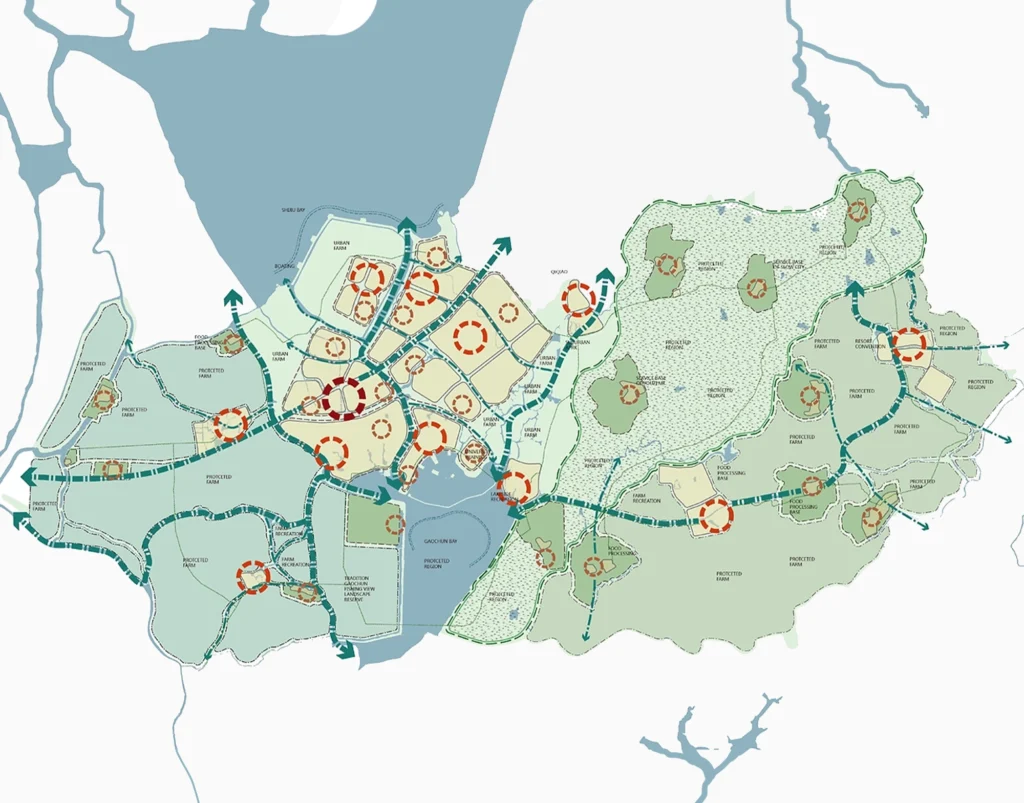
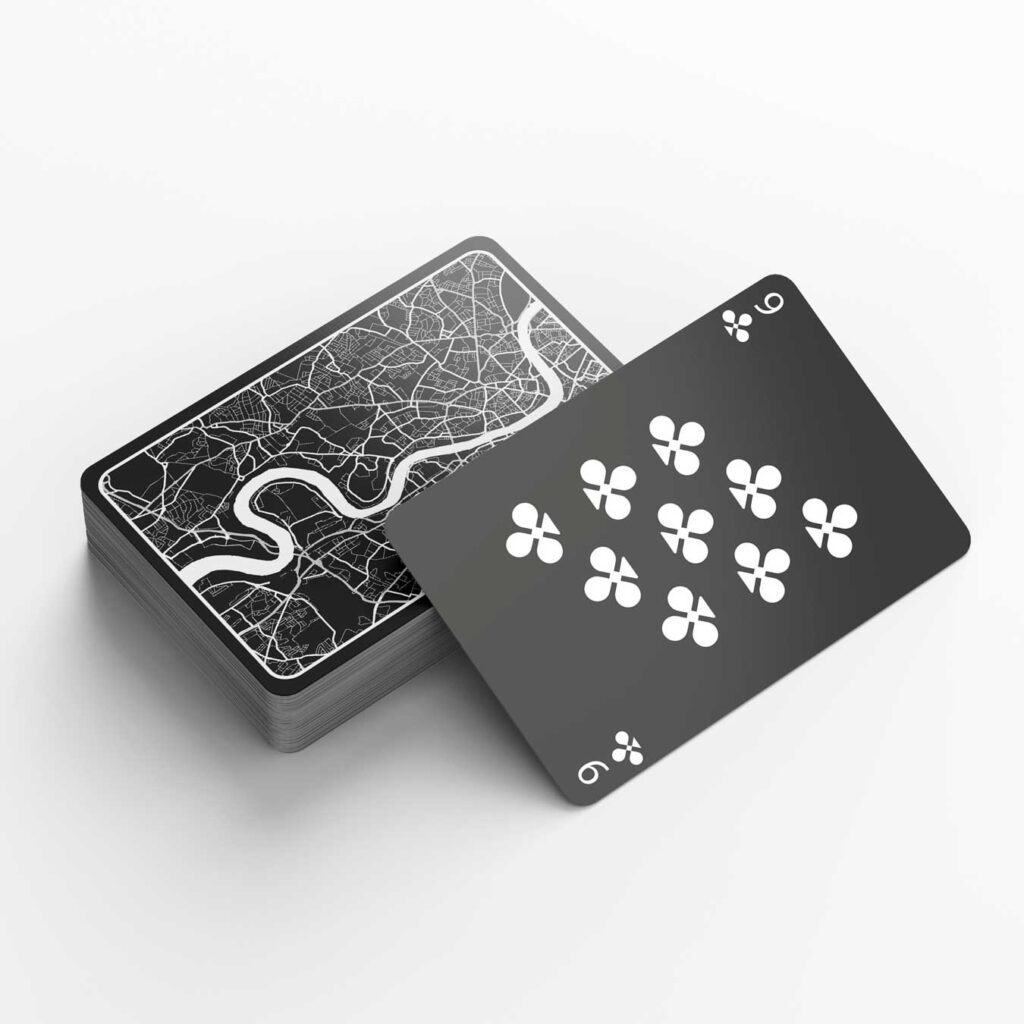
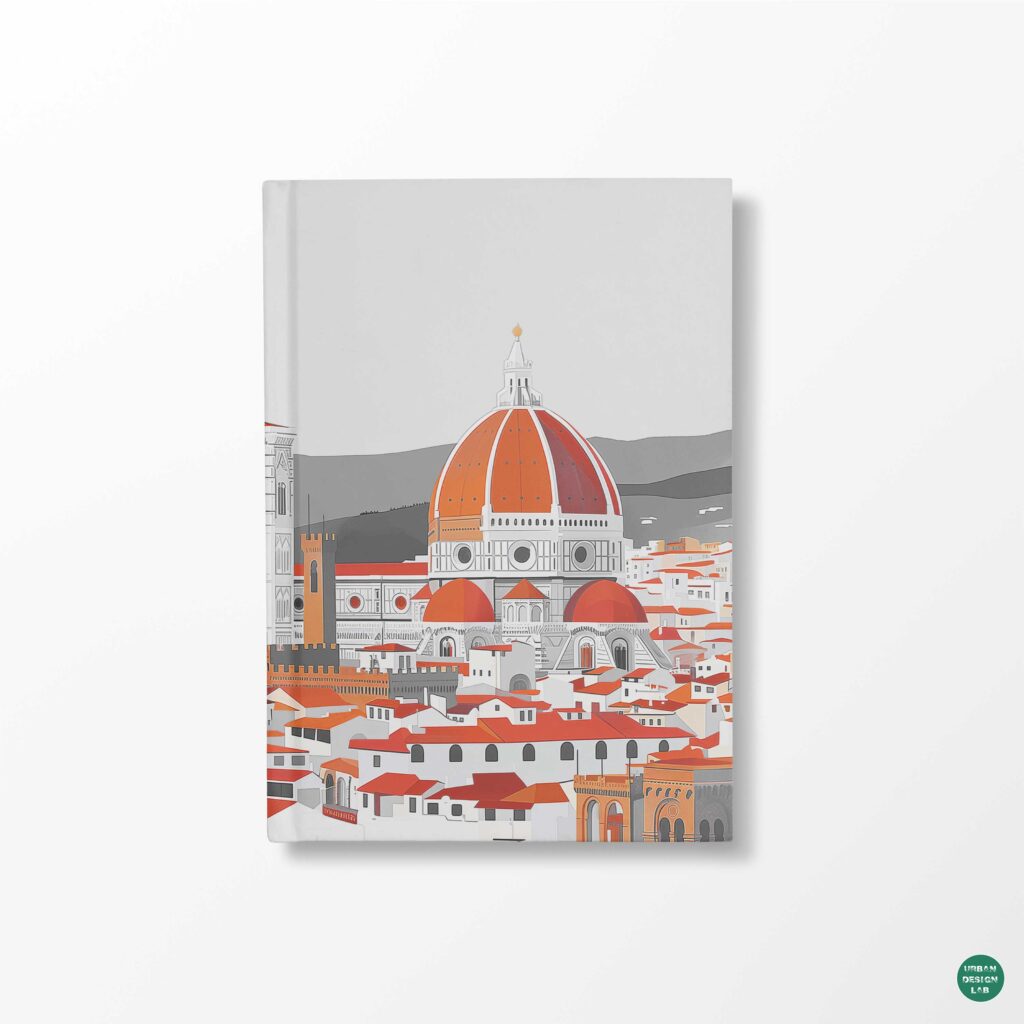
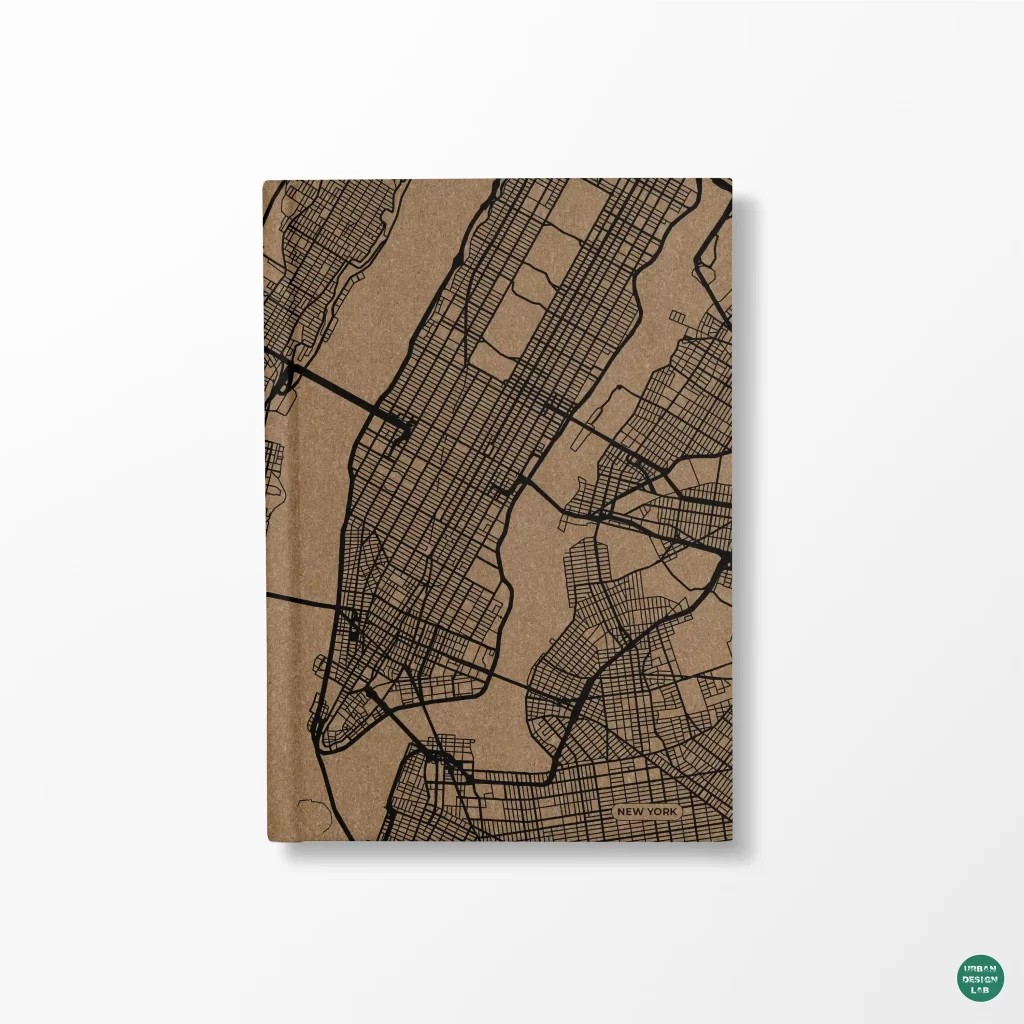
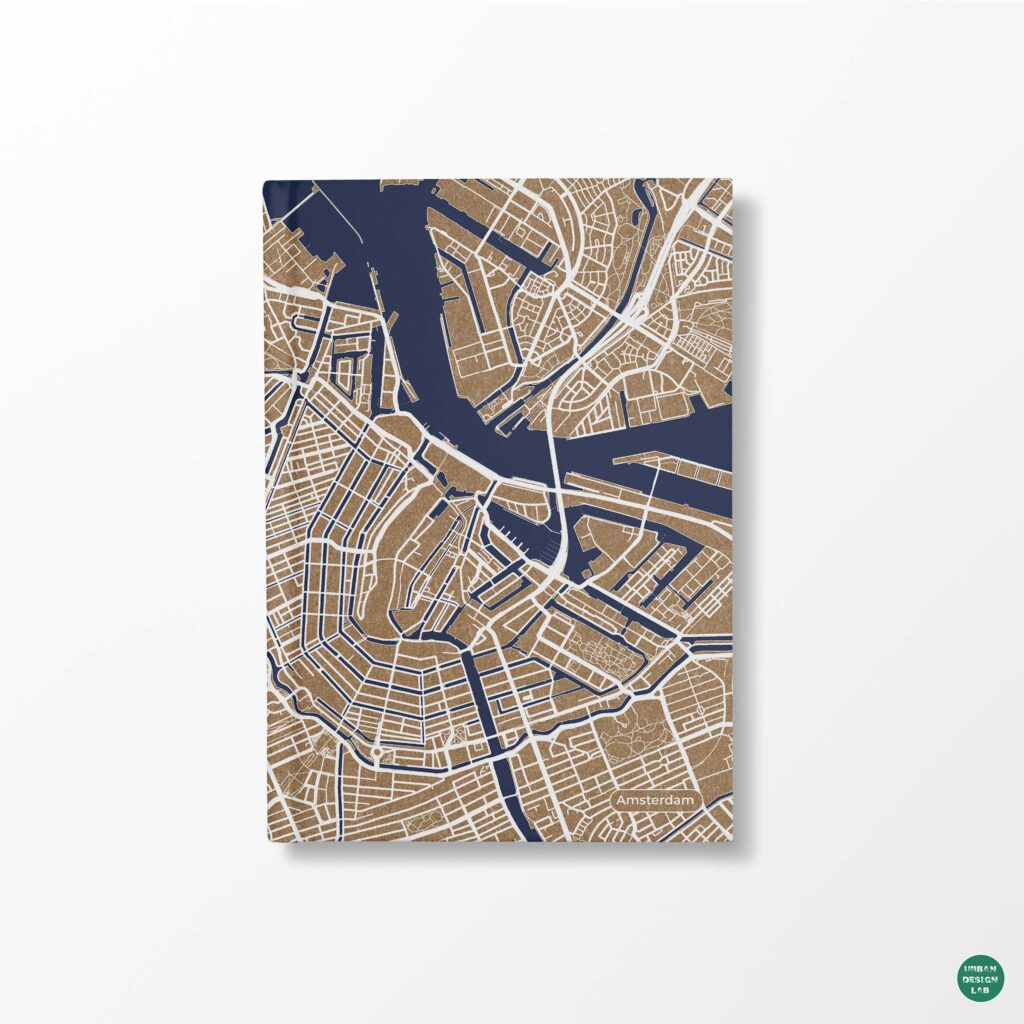
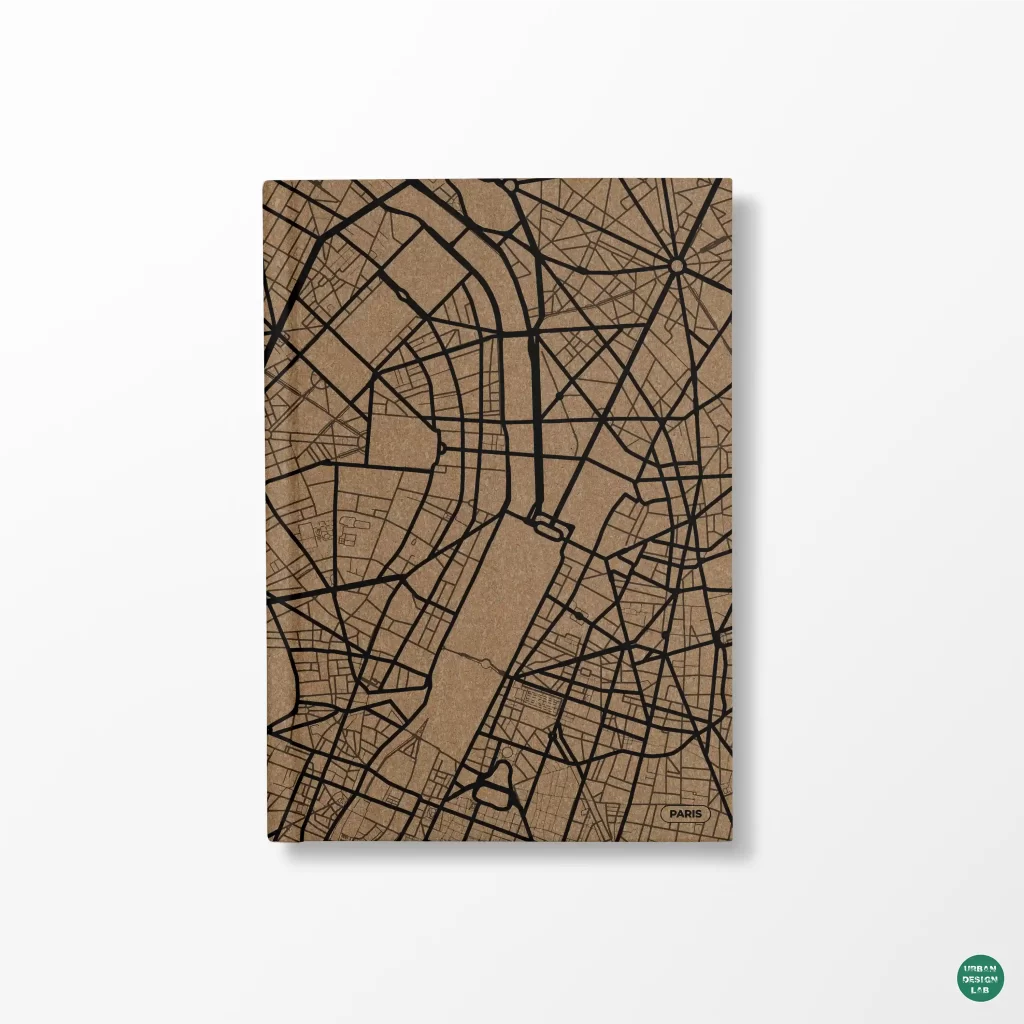
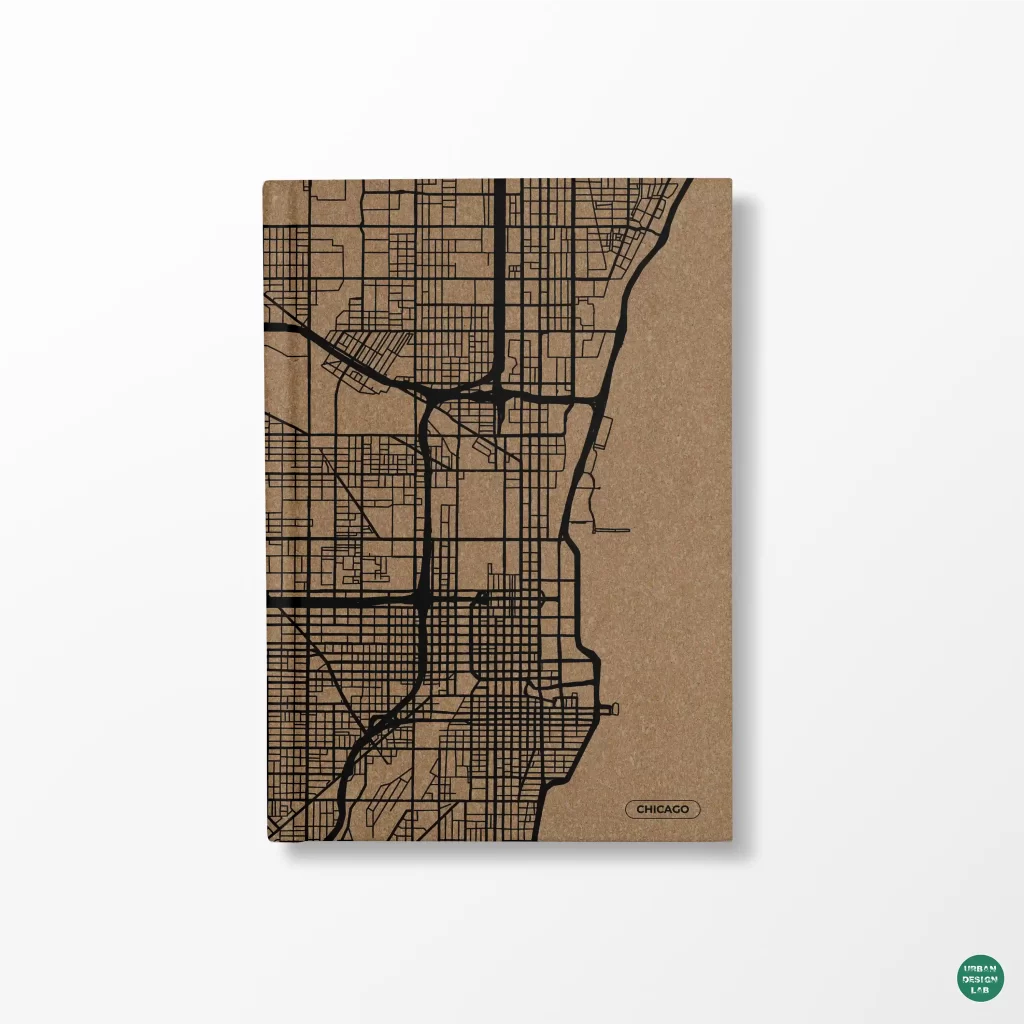
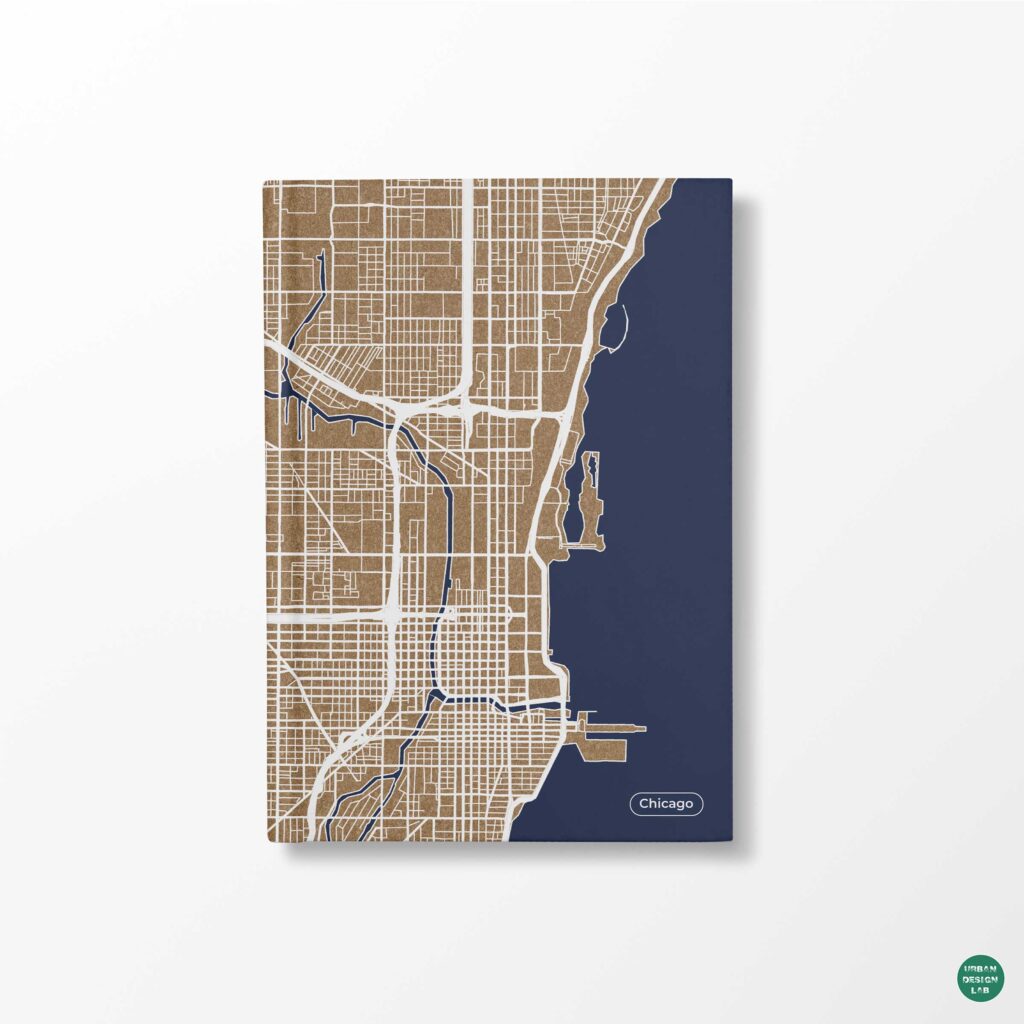
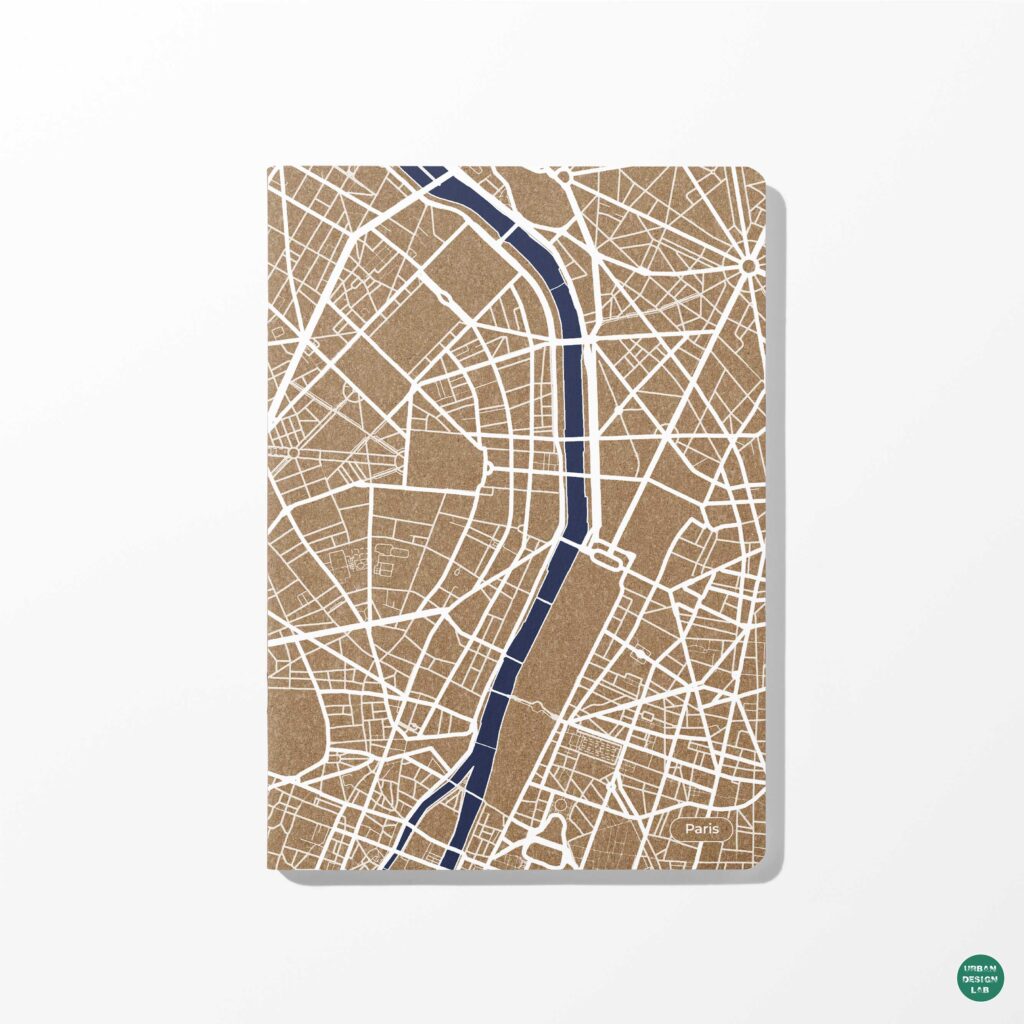
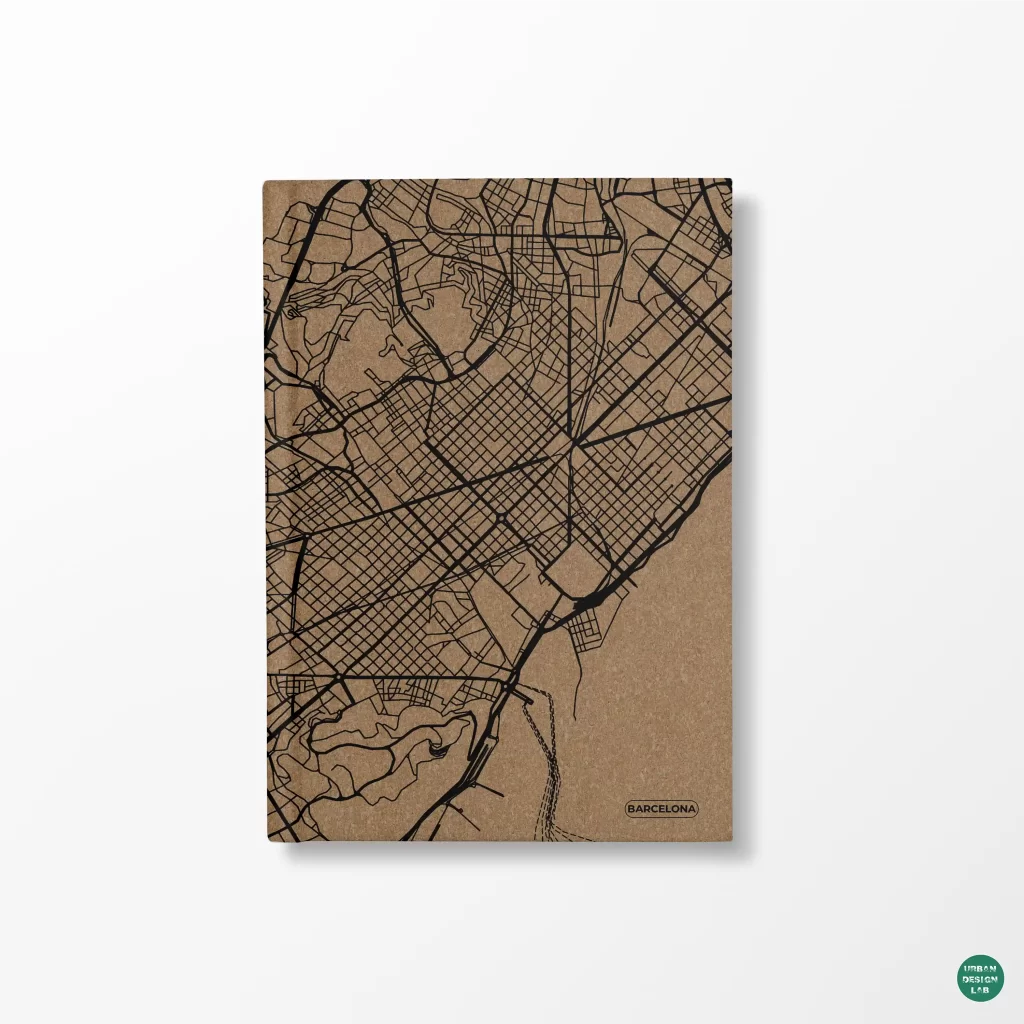
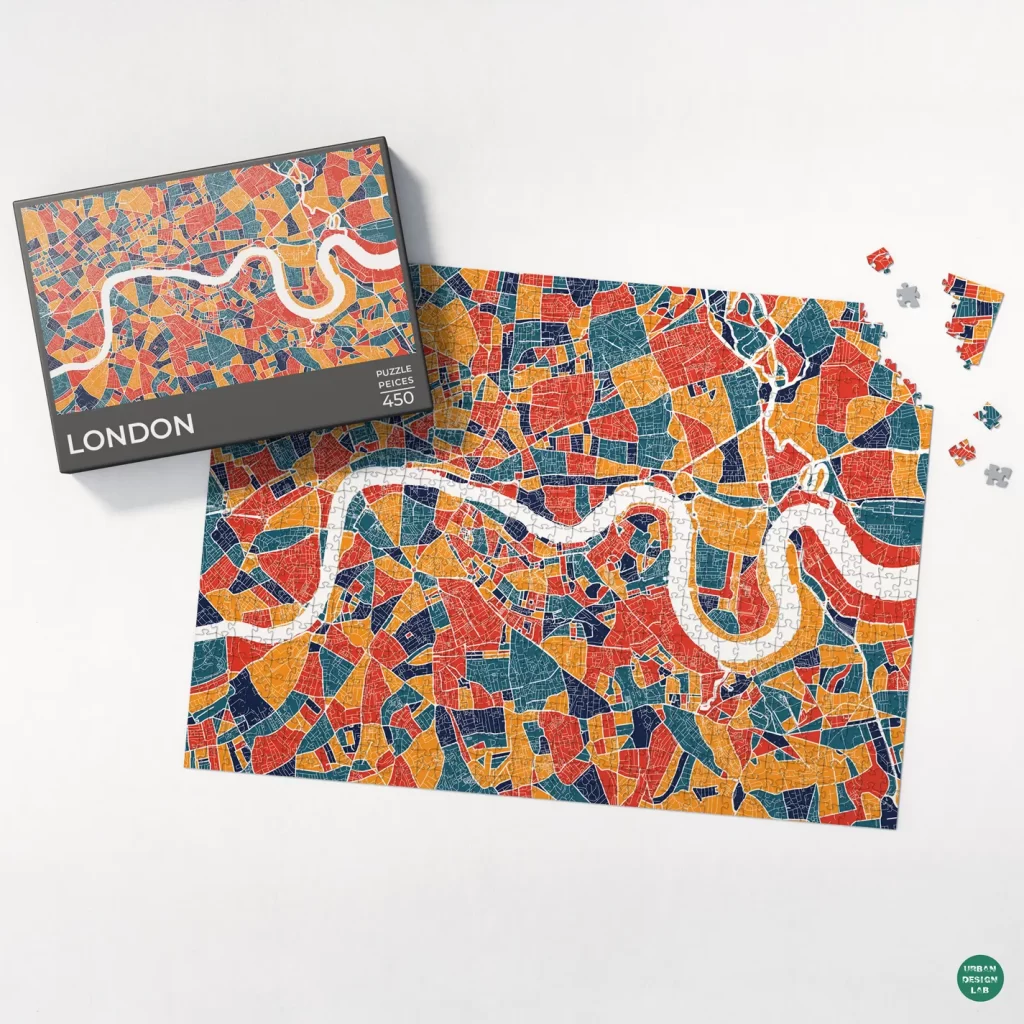
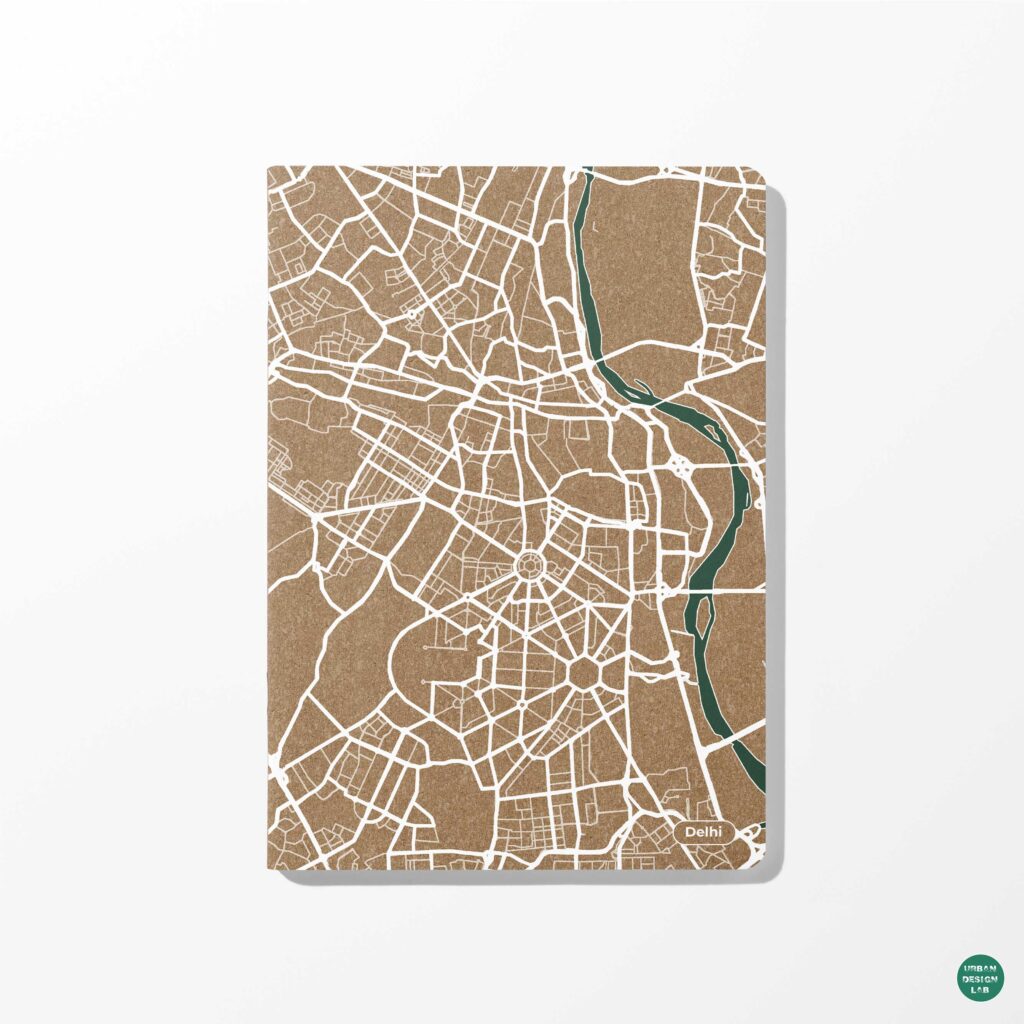
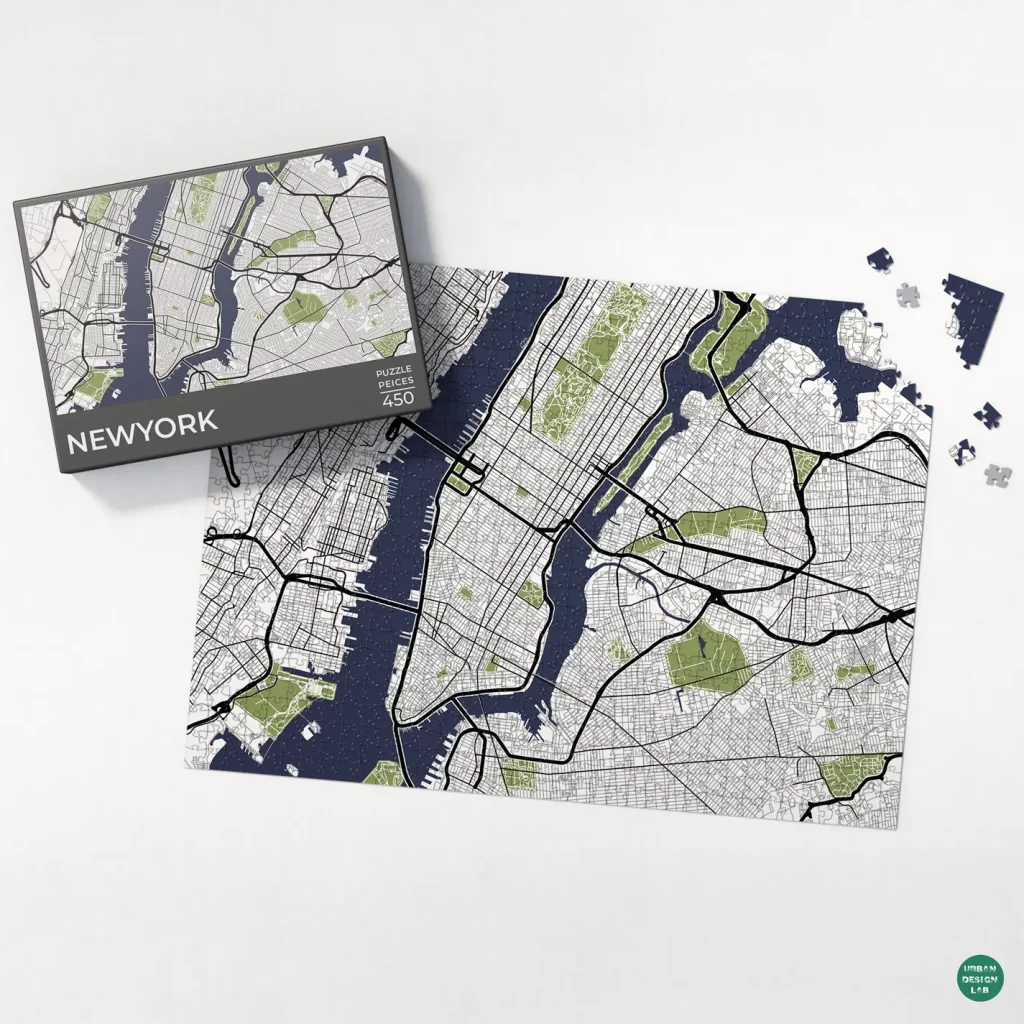
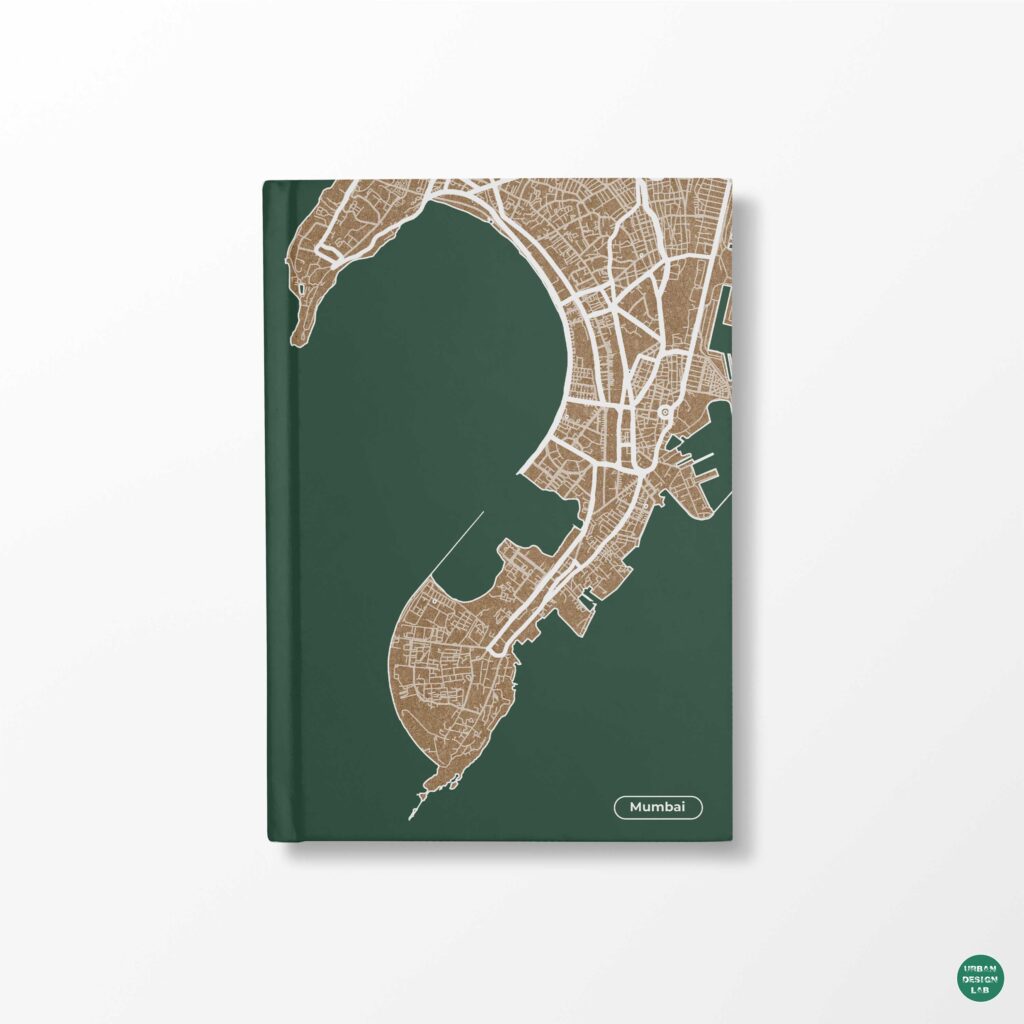
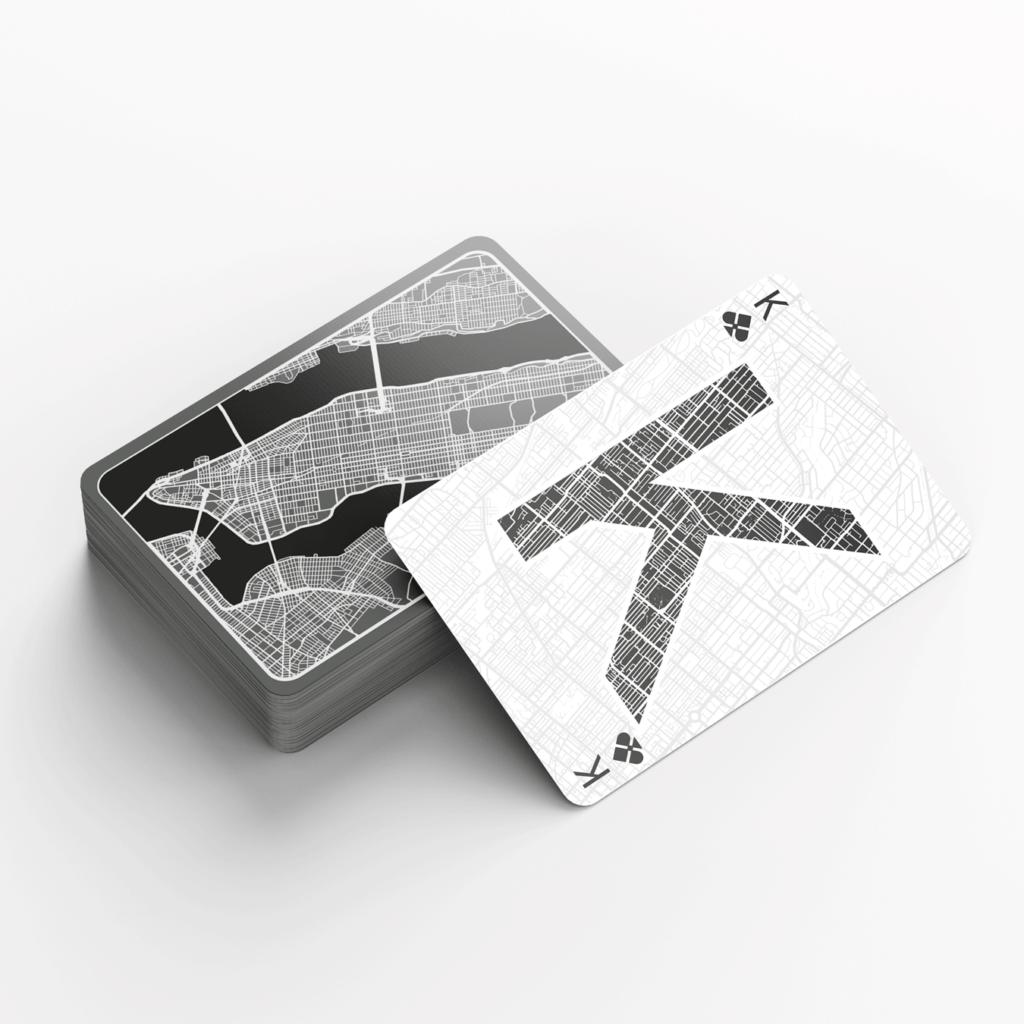
Urban maps comparison showing professional map design with clear hierarchy and colour

Urban maps often fail in a surprising way: their geographic information may be technically correct, yet the reader cannot identify the main argument. Roads compete with labels, building footprints merge into indistinguishable textures, a rainbow classification obscures the actual distribution, and the map’s legend requires more effort than the evidence it explains. The opposite failure also occurs. A carefully styled drawing can feel authoritative while masking an inappropriate denominator, an outdated boundary or a misleading geographic comparison. The crucial distinction is therefore not between beautiful and ugly maps. It is between maps whose visual decisions make their evidence intelligible and maps whose design makes claims harder to evaluate.

The distinction matters to urban designers, planners, transport researchers and architectural students because the same spatial material must travel between analysis, design review, public consultation and academic publication. A settlement-density map for an exploratory studio discussion has different obligations from a map used to justify infrastructure investment. Nevertheless, both need to establish what is being shown, why those features matter and what the available data cannot establish. Cartographic principles such as legibility, figure-ground organisation, hierarchy and proportion are explicitly articulated in professional cartography guidance (Esri cartography guidance); statistical agencies likewise caution against thematic maps that show raw counts or unnecessary geography simply because a shapefile exists (ONS choropleth guidance).

This article argues that professional mapping is a process of disciplined selection, not a software effect. It examines evidential validity, graphic hierarchy, classification, geographic context, and the production workflow that holds these components together. Throughout, “professional” describes a map that can be read, questioned and reproduced, rather than a particular colour palette or aesthetic fashion.

A credible map begins with a defensible geographic claim

A map can only communicate an analysis that has been defined. Before selecting fonts, line weights or textured backgrounds, its author should identify the analytical unit, geographic extent, reference date, measured attribute and intended comparison. Consider a hypothetical exercise mapping access to public open space across wards. The headline question may be whether residents are located near a park, whether open space is distributed equally, or whether wards provide comparable park area per resident. These are related but distinct questions. A map showing ward boundaries and green parcels cannot by itself answer all three.

The choice of numerator and denominator is decisive. An absolute number of facilities can represent the distribution of service locations, while a rate per resident examines supply relative to population. For area-based choropleth maps, the UK Office for National Statistics advises standardised rates rather than unnormalised totals because area size and population can distort apparent patterns (ONS choropleth guidance). This is guidance for a particular statistical graphic, not a ban on showing counts: proportional symbols, dot-density methods and accompanying tables may be appropriate when absolute quantities are substantively important. The methodological obligation is to match the symbol to the question.

The geographic support of the data needs the same scrutiny. Ward-aggregated travel-time estimates cannot be interpreted as travel times experienced by every individual within a ward. Disparities inside that unit remain hidden. The choice of administrative boundary can also create apparently sharp visual differences across adjacent areas even where the underlying phenomenon changes gradually. Therefore, a choropleth should tell readers the aggregation scale, data source and measurement period, especially when the resulting pattern might be mistaken for a street-level diagnosis.

Projection is another substantive decision. The U.S. Geological Survey explains that every planar projection distorts some combination of area, distance, direction or shape, and no projection preserves all of them (USGS projection guidance). For pedestrian-accessibility analysis, projected coordinates appropriate to the local study area are ordinarily more useful for distance calculations than treating longitude and latitude as planar metres. For comparative continental patterns, an equal-area projection may be more defensible than a familiar web-map projection. The best choice depends on the analytical property that must remain interpretable.

A professional map makes these choices legible through a source line, meaningful title, transparent classification and, where needed, a note on limitations. Strong typography cannot repair an unsuitable denominator. Conversely, a rigorous analysis that conceals its variables behind vague labels such as “high access” or “low development” remains difficult to evaluate. Cartographic credibility begins before graphic composition.

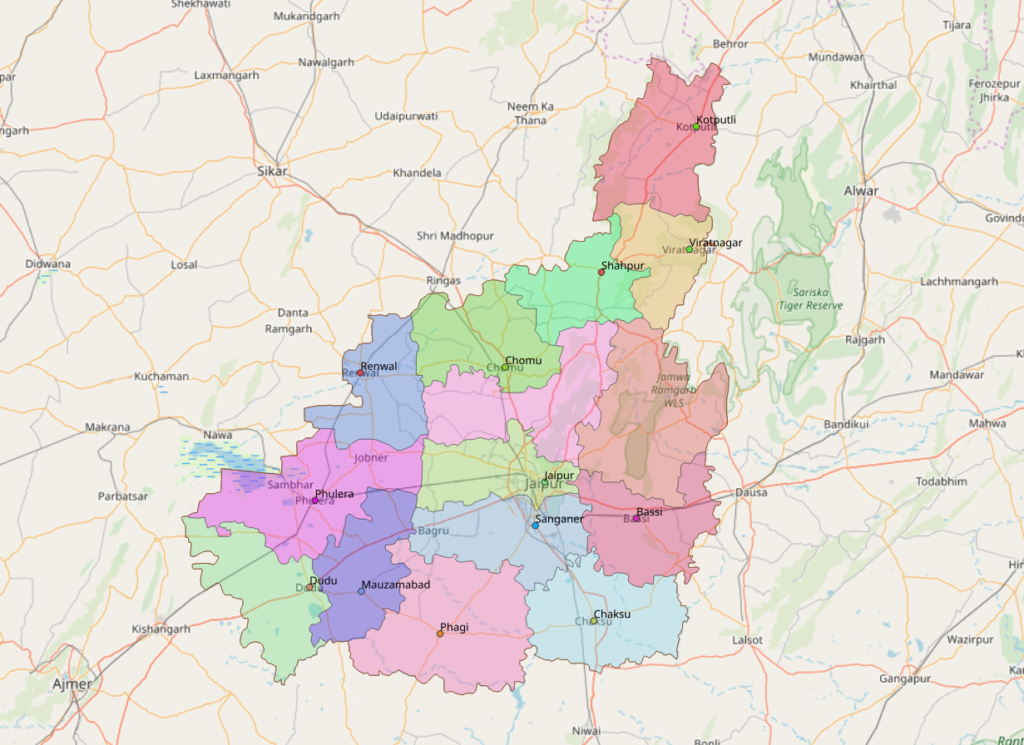
Jaipur district and subdistrict administrative map over a regional basemap
A mapped administrative division illustrates the need to distinguish geography from the visual coding applied to it. Image: Heinz OSM, ODbL, via Wikimedia Commons.

Visual hierarchy tells the reader what matters first

The next distinction concerns attention. In complex urban drawings, networks, plots, green spaces, nodes, landmarks and annotations all compete on the same page. If every element has saturated colour, thick strokes and identical label weight, there is no useful ordering. Aileen Buckley’s professional cartographic guidance treats legibility, visual contrast, figure-ground, hierarchy and proportion as interdependent design principles (Esri cartography guidance). Their significance lies in communication: a graphic variable must encode the analytical priority rather than simply decorate the page.

A map of pedestrian conflict points, for example, may need street intersections and observed incidents to lead the reading sequence. Building footprints can be a restrained grey, while the movement network remains visible at a finer weight and the incident points carry the strongest contrast. In a heritage-precinct map, the boundary of the study area and the key urban spaces may instead take priority. These are editorial decisions derived from the question. There is no universal rule that buildings must always be dark or roads must always be red.

Figure-ground relationships help establish a visual subject. Neighbouring administrative areas can be faded so that the case-study precinct remains distinct; water bodies can be held at a consistent visual value; and minor roads can be suppressed at smaller map scales. The USGS describes such changes in detail and symbolism as cartographic generalisation: what should be displayed differs according to the extent and scale of the view (USGS cartographic representation). This means that removing irrelevant local lanes from a regional map can improve accuracy of communication even though the GIS database retains those features.

Labelling is often where professional discipline is most visible. A road label should identify its road without hiding the movement network. A neighbourhood name should be visually distinguishable from a street label. Labels ought to follow a controlled hierarchy, not simply the availability of annotation tools. Rather than rendering every feature name, determine which labels support orientation, interpretation and verification. Keep labels legible at the actual publication size, because a type size that looks acceptable at high zoom may fail once reduced to a journal column or presentation slide.

Whitespace also performs analytical work. It separates the main map from its legend, data note, title and inset. An inset map should serve a clear purpose, such as locating an unfamiliar precinct within a metropolitan region, instead of reproducing the main argument at a second scale. The guiding test is simple: can a knowledgeable reader identify the map’s topic, principal pattern and source without a verbal presentation? If not, another graphic effect is unlikely to help.

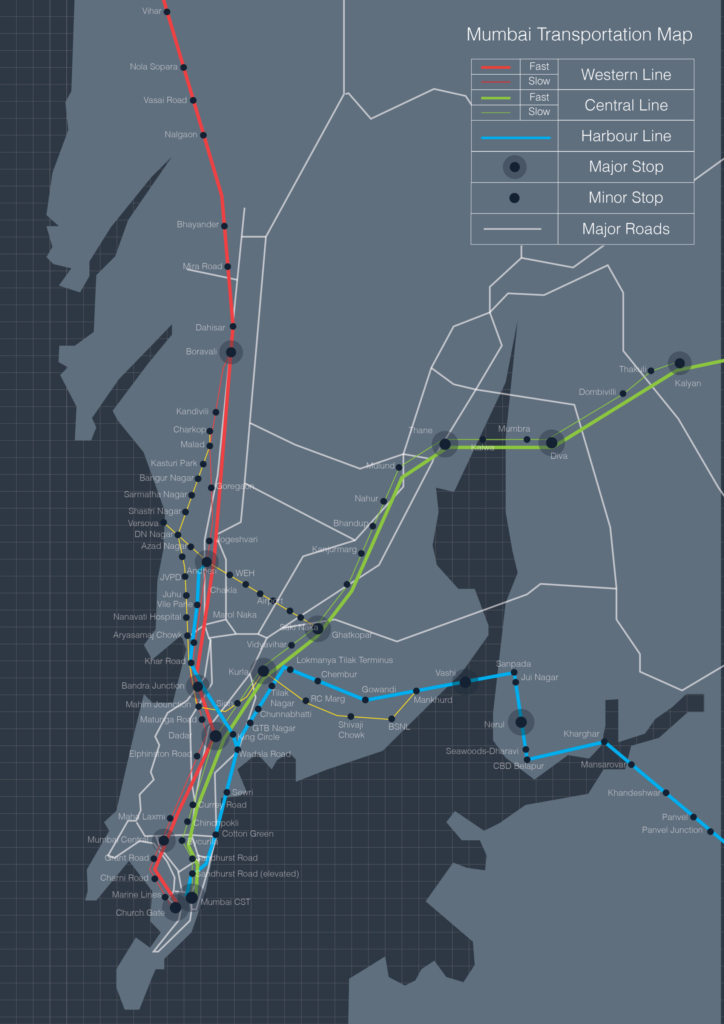
Historic Mumbai rail and major-road transport schematic
An older transport diagram illustrates hierarchy through differentiated lines, colours and symbols; it is not a current route guide. Image: Aarushi mishra, CC BY-SA 3.0, via Wikimedia Commons.

Colour and classification should encode meaning, not mood

Professional colour decisions are semantic before they are aesthetic. A sequential palette suits ordered magnitudes such as density or proportion; a diverging palette can express positive and negative departures around a meaningful centre; and distinct categorical hues can distinguish mutually exclusive land-use classes. Official statistical guidance recommends sequential or diverging schemes for choropleths according to the data, with a manageable number of distinguishable bands (ONS choropleth guidance). Using a dramatic red-green gradient across nominal land-use categories, by contrast, may imply an order that does not exist.

Classification boundaries matter as much as hue. Quantiles place a similar number of geographic units in each band but can exaggerate modest differences in a narrow distribution. Equal intervals are intuitive when a meaningful numerical range exists, yet they may concentrate most observations in one class. Natural breaks fit the empirical distribution but complicate direct comparison across different maps if each panel receives new thresholds. A professional series should decide whether consistency across dates, local variation or a fixed policy standard is the primary objective, and should make that decision visible in the legend.

A hypothetical ward map could classify tree-canopy percentages using identical breakpoints across two survey years. This would support a like-for-like visual comparison, assuming the source data and calculation methods were comparable. Using independently recalculated quintiles would instead rank wards within each year, potentially hiding an overall change. Neither method is inherently incorrect, but the claim readers can make from the graphic differs. The legend should not leave that distinction implicit.

Accessibility adds another layer. The W3C’s WCAG 2.2 standard states that colour should not be the only means of conveying information in covered web interfaces and sets contrast criteria for relevant text and non-text elements (W3C WCAG 2.2). These web accessibility requirements are not an automatic specification for every printed map, but they are a valuable design benchmark. Where practical, combine colour with explicit labels, differentiated line patterns or symbols; test the image in greyscale; and assess actual contrast after the map is exported to its target format.

Colour restraint can also improve consistency across a publication. Use a limited base palette for roads, built fabric, water and vegetation, reserving the strongest accent for the selected phenomenon. A carefully selected sand or green background is not evidence in itself. If a colour choice changes the apparent prominence of a finding, the author must be able to explain why that emphasis is justified.

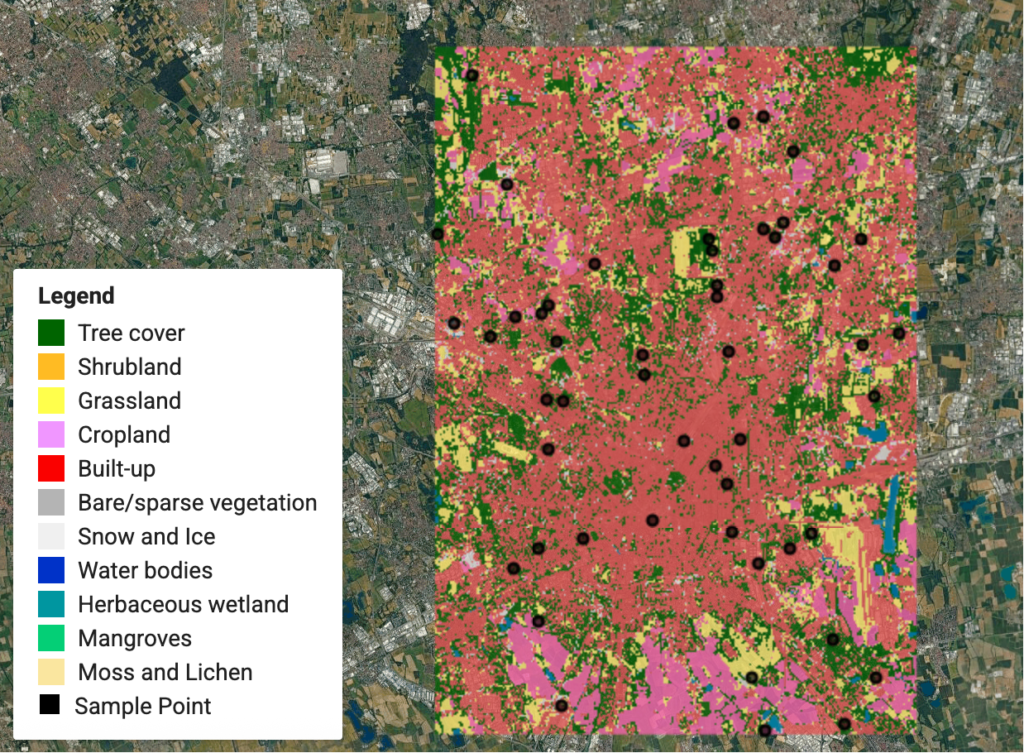
Land-cover classification with site sampling points and satellite context
Category colours, points and imagery compete for attention unless their relative emphasis is deliberate. Image: Qiongjx, CC BY-SA 4.0, via Wikimedia Commons.

Extent, scale and context determine what a map can reasonably show

The difference between an instructive urban map and an attractive but ambiguous one often lies outside its central data layer. Extent determines what counts as context. A map cropped tightly to a project boundary may exclude a major barrier, rail station or adjoining neighbourhood that explains the pattern. Yet a metropolitan-wide extent may shrink a detailed site analysis until pedestrian paths and plot grain become unreadable. There is no ideal crop independent of the research question.

A regional locator, neighbourhood map and site-scale figure serve separate functions. Rather than forcing all three into one crowded composition, a coordinated series can move from regional position to network relationships and then to local morphology. The map scale must be treated consistently with the resolution and completeness of the underlying data. A highly detailed building layer from one municipality placed beside much coarser adjacent data can create a false impression of urban differences that actually reflect documentation practices.

The UK Office for National Statistics advises that maps are not always the best representation simply because a dataset is geographic; when comparisons involve only a few geographic units, a bar chart may be clearer (ONS choropleth guidance). For a study comparing three transit corridors, a compact chart of frequency or travel time could make rank differences more legible than three coloured polygons. Mapping remains valuable when geography explains the pattern, such as barriers, catchments or spatial clustering. Good evidence communication sometimes means choosing not to make a map.

Urban design examples illustrate the point. A plot-coverage study benefits from built versus open-space drawings at a consistent scale. A pedestrian-permeability analysis needs the finer network and the barriers that shape accessible paths. A climate-exposure map may need shaded routes, materials and tree-cover proxies, with explicit caution that a land-cover map is not itself a measured air-temperature map. Changing the base map is appropriate when the analytical purpose changes; a single visual template should not become a methodological straitjacket.

The practical solution is to separate GIS project completeness from publication completeness. Keep the underlying dataset, metadata and analytical layers intact, but publish only what the reader needs to investigate the stated question. Include a north arrow when orientation is uncertain, a scale statement when distance matters, and a carefully prepared legend whenever symbol meaning is not self-evident. Each item should earn its space.

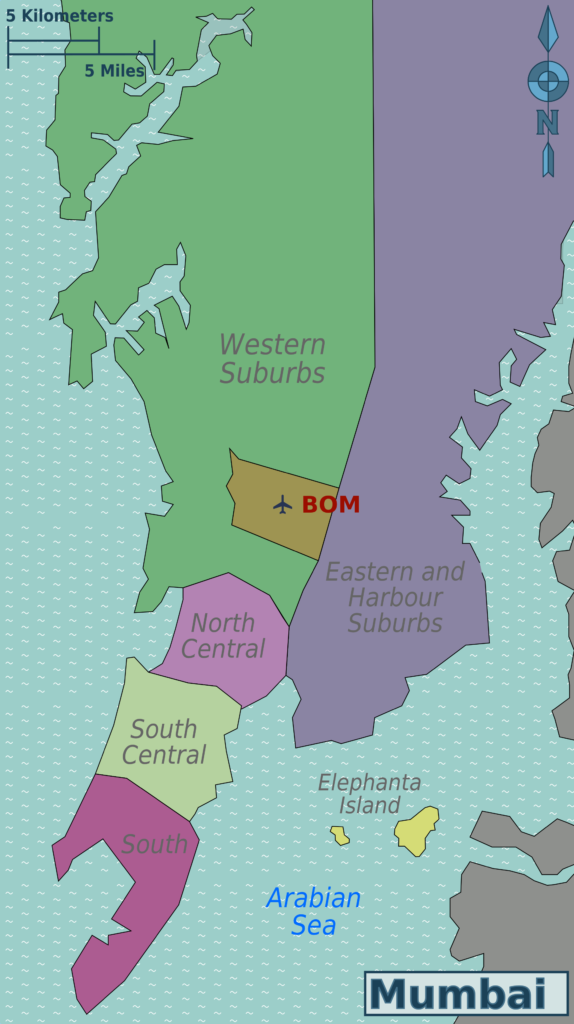
Mumbai regional locator and district map with a scale graphic
Extent and geographic context determine which spatial details are legible and defensible. Image: Saqib Qayyum (original), Sbb1413 (derived work), CC BY-SA 3.0, via Wikimedia Commons.

Professional finishing is a controlled production and review process

Software becomes essential once the analytical and graphic decisions are settled. QGIS Print Layout supports managed map frames, legends, labels, scale bars, tables and output to image, PDF and SVG formats (QGIS print layout documentation). Adobe Illustrator can refine path work, typography and vector composition; Photoshop can help with raster terrain, imagery and tonal editing. But these capabilities operate at different points in the workflow. Treating Photoshop as a place to redraw analytical boundaries can break traceability, while treating Illustrator as a substitute for GIS analysis can strip geographic meaning from the work.

A reliable production sequence preserves a working GIS project containing sources, coordinate reference systems, symbology and analysis settings. Create a publication layout at the intended dimensions. Export an archival version and, if further graphic editing is necessary, a vector-oriented PDF or SVG. QGIS explicitly notes that some rendering options cause rasterisation and that forcing vector export may change appearance (QGIS export documentation). The result should be inspected in its destination application rather than assumed to be identical.

Quality control needs two distinct passes. The analytical pass checks data vintage, geometry, joins, classification, units, source and interpretation. The communication pass checks hierarchy, spacing, label collisions, legend completeness, colour distinction, output resolution and readability at real size. A professional document can fail either pass. A missing district name is not merely a visual error if it changes how readers identify a result. A shapefile with outdated neighbourhood divisions is not made current by sophisticated typography.

Reproducibility should also be considered. Preserve original layers rather than only a flattened final image. Record which fonts were used, which classes were applied and whether any values were manually adjusted in a graphics editor. Maintain clear distinctions between mapped observation, analytical inference and proposed design intervention. When a design proposal is drawn over a survey map, the reader should be able to separate what currently exists from what is hypothetical.

Finally, test the map with a reader who has not seen the research process. Ask what they think is being measured, what the darkest category means and which source generated the drawing. Their interpretation provides evidence about communicative clarity, not about the validity of the data. The map is ready for publication only when its visual order supports, rather than substitutes for, its geographic argument.

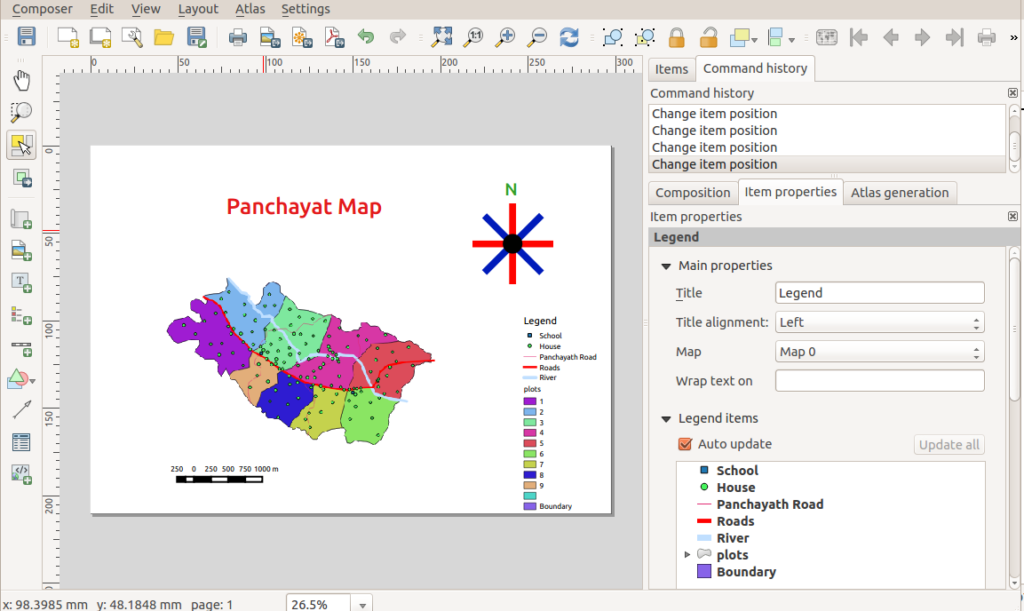
QGIS print layout showing a map, symbols, north arrow and legend
Map composition requires checking content, scale graphics, legend and typography as one publication plate. Image: Path slopu, CC BY-SA 4.0, via Wikimedia Commons.

Conclusion

Professional urban mapping cannot be reduced to smoother linework, fashionable colours or a preferred graphics application. It requires an explicit spatial question, a defensible measure, appropriate generalisation and projection, a hierarchy aligned with evidence, and a production workflow that preserves traceability. Professional cartography guidance and official statistical practice support this combined understanding of analytical integrity and communication (Esri cartography guidance) (ONS choropleth guidance). The strongest urban map is not necessarily the most visually complex. It is the one that makes its core claim intelligible, its sources inspectable and its limitations difficult to overlook.

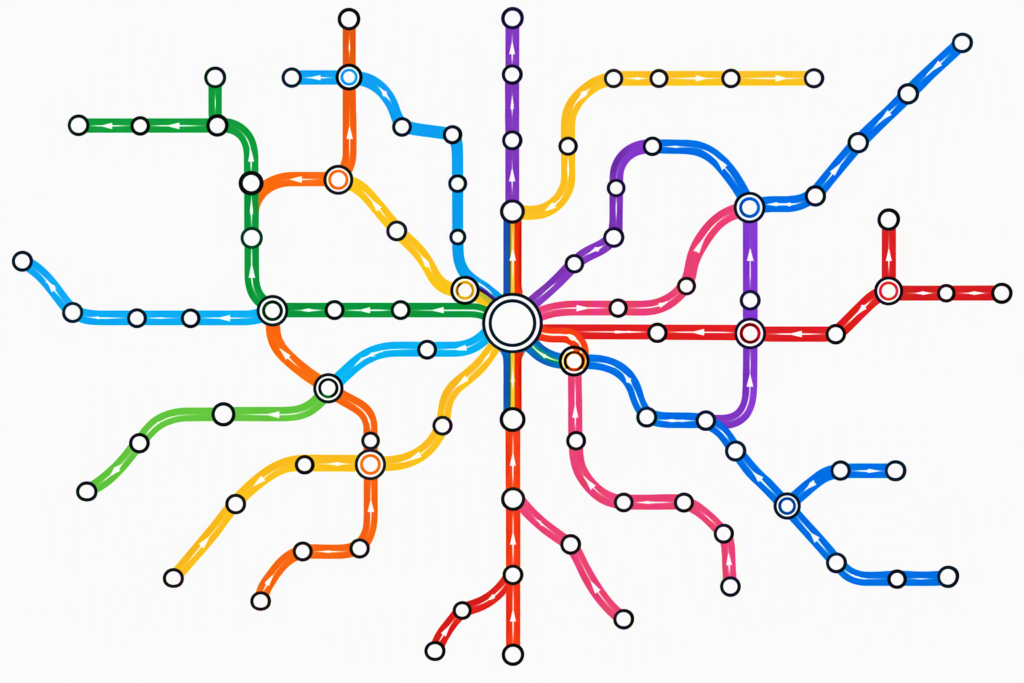
Abstract transport network with coloured routes and interchange symbols
Clarity results from consistent graphic logic, not from adding visual effects. Image: Nwongh, CC BY 4.0, via Wikimedia Commons.

Leave a Reply

Your email address will not be published. Required fields are marked *

This site uses Akismet to reduce spam. Learn how your comment data is processed.

Related articles

UDL Thesis Publication 2025

Call for Abstracts now open!

Urban Mapping

MASTERCLASS

Urban Mapping, Analysis and Representation

Session Dates

21st- 22nd November 2026

Curating the best graduate thesis projects globally!

Publish your work and get recognized globally!

Free E-Book

From thesis to Portfolio

A Guide to Convert Academic Work into a Professional Portfolio”

Urban Design Lab

Be the part of our Network

  • Stay updated on workshops, design tools, and calls for collaboration

  • Thesis Report Writing for Architecture and Urban Studies

    Join Our WhatsApp Group

    Recent Posts

    Sign up for our Newsletter

    “Let’s explore the new avenues of Urban environment together “

    E-Book- From Thesis To Portfolio

    A Guide to Convert Academic Work into a Professional Portfolio