Google Earth 2026 Features for Site Analysis Contours Terrain and Geospatial Data

Google Earth 2026 terrain and contour view used for architectural site analysis

An evidence-led review for architecture, planning, transport and urban research

Site analysis is often presented as a preliminary design exercise, yet early readings of land, access, infrastructure and environmental conditions can influence land acquisition, project cost, climate-responsive layout, risk screening and public consultation. A visually convincing aerial image is not equivalent to reliable ground evidence, but poorly structured desktop assessment can also obscure obvious constraints.

This distinction has become more important with Google Earth’s 2026 professional feature set. Google Earth is no longer only a globe viewer or image-reference platform. Its web environment includes site-level terrain analysis, elevation profiles, historical imagery, data-layer imports and a growing catalogue of contextual datasets. The central argument of this article is that these features are most valuable when used as a structured environment for identifying and testing spatial questions before costly fieldwork or detailed modelling begins. They do not replace survey, GIS, engineering analysis or field verification.

Google announced new contours, slope, aspect, cut-and-fill and experimental change-detection tools on 22 September 2026. See Google Earth announcement.

From visual reconnaissance to structured site intelligence

Google Earth’s enduring strength is the integration of satellite and aerial imagery, three-dimensional topography, geographic data and Street View in a navigable spatial interface. This combination is especially useful at the beginning of a project, when the important question is often comparative rather than final: which edges are physically accessible, where does a drainage line appear to cross the site, which neighbouring parcels are developing, and where do buildings, tree cover, water bodies or embankments interrupt a proposed route?

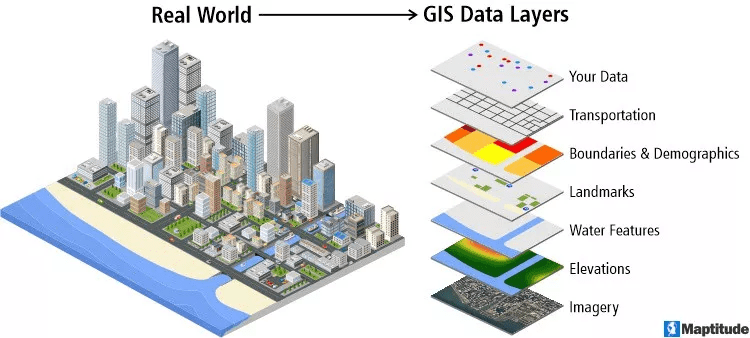
The current platform supports this work more effectively because site information can be assembled in a project rather than remaining a collection of screenshots. Google Earth for web and mobile supports direct import of KML, KMZ, GeoJSON and zipped Shapefiles. CSV and Google Sheets imports are documented as experimental. This matters because site assessment should not rest on imagery alone. Parcel boundaries, road rights of way, flood zones, transit stops, land-use controls, utilities and environmental constraints generally originate outside Google Earth and should retain their original source, date, coordinate reference system and stated limitations.

The platform is therefore most useful when it turns a diffuse briefing exercise into visible, testable propositions. A proposed school site, for example, can be mapped with its parcel boundary, observed crossing points, pedestrian catchment, drainage corridors, tree cover, public-transport stops and potential emergency-vehicle access. This does not establish legal access, traffic capacity or flood safety. It does make the questions requiring verification legible to a multidisciplinary team.

This is a methodological improvement over choosing a site through unannotated satellite imagery. A shared project can preserve the logic of preliminary assessment, show the source of each layer and enable reviewers to challenge an interpretation. Its limitation is equally clear: an imported layer is only as dependable as its source. Google Earth visualises data. It does not automatically validate ownership, accuracy, temporal relevance, statutory status or analytical method.

Google Earth capability and import documentation: Google Earth capabilities.

Google Earth data import documentation.
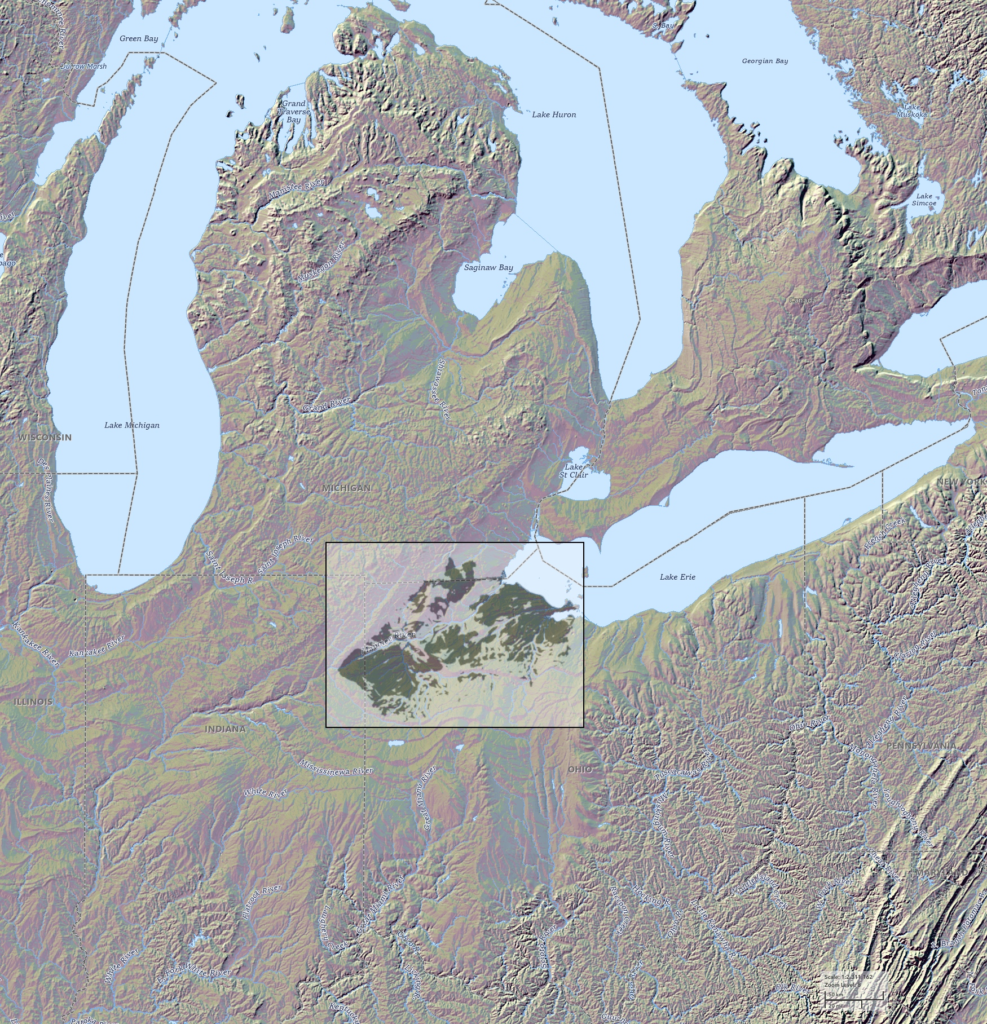
Suggested photograph: Digital elevation model and hillshade visualisation of the Great Black Swamp, showing terrain-derived landform patterns.

Image link:https://upload.wikimedia.org/wikipedia/commons/0/0a/Great_Black_Swamp_USGS_DEM_aspect_map_Hillshade_Stretched.jpg

Suggested caption: Terrain visualisation can reveal patterns that are difficult to detect in conventional aerial imagery alone.

Credit: GeoFAXsafety79, CC0 1.0 Universal Public Domain Dedication. Attribution is not legally required but should be retained editorially.

Contours slope aspect and cut and fill are useful early tests not construction evidence

The major 2026 change is point-and-click terrain analysis in Google Earth. The experimental documentation states that a user may draw a site polygon and generate layers for contours, slope, aspect and cut and fill. The contours tool permits an integer interval between 1 and 20 metres. For site analysis, the value of contours is not merely graphic. They show the continuity of landform and can indicate a ridgeline, basin, saddle, drainage direction, apparent terrace or likely retaining-wall condition that is less obvious in an oblique three-dimensional view.

A one-metre interval can reveal local variation more clearly than a ten-metre interval, but apparent precision should not be mistaken for verified vertical accuracy. A close interval increases the density of displayed contour lines. It does not improve the accuracy of the underlying elevation model. Slope analysis can highlight terrain likely to complicate universal accessibility, road design, stormwater management, building-pad selection or construction logistics. Aspect adds the direction a slope faces, which may influence solar exposure, vegetation and surface conditions. Those relationships remain context dependent because surrounding buildings, vegetation, local wind, soil moisture and material choices also matter.

The cut-and-fill tool is particularly likely to be misunderstood. Google describes it as an approximate calculation based on a target base-elevation plane. It may help teams compare broad grading scenarios before commissioning a detailed civil-engineering model. It should not be used for tender quantities, contractor pricing, approvals or construction instructions. Accurate earthwork calculations depend on a verified survey surface, a defined design surface, material swell and shrinkage assumptions, exclusion zones, drainage specifications and engineering judgement.

Google’s own catalogue cautions that its global contour layers are inferred, may contain errors and are not equivalent to onsite or survey-grade information. The correct interpretation is probabilistic: the tool can identify where detailed survey effort should concentrate, rather than eliminate the need for survey.

Source: Google Earth terrain-analysis documentation.
Limitation source: Google Earth available data layers.

Suggested photograph: Digital elevation model and hillshade visualisation of the Great Black Swamp, showing terrain-derived landform patterns.

Image link:https://upload.wikimedia.org/wikipedia/commons/0/0a/Great_Black_Swamp_USGS_DEM_aspect_map_Hillshade_Stretched.jpg

Suggested caption: Hillshade and elevation data make subtle gradients visible, but their interpretation still requires verified local survey data.

Credit: GeoFAXsafety79, CC0 1.0 Universal Public Domain Dedication. Attribution is not legally required but should be retained editorially.

Elevation profiles improve route and corridor analysis

A site is rarely an isolated polygon. Streets, pathways, drainage channels, utility alignments and public-space connections cross boundaries and link a project to a wider urban system. Google Earth added an Elevation Profile tool on 30 April 2026. When a line or path is drawn through Measure or Drawing tools, an interactive terrain profile appears in the inspector panel.

This feature has practical relevance for urban street and mobility analysis. A profile along a walking route can reveal whether a seemingly short connection contains a sharp change in level. A profile along a potential cycling corridor can identify terrain segments likely to require a more cautious design response. Along a road alignment, it can assist preliminary discussion of visibility, drainage direction, crossings, embankments and the relationship between street grade and adjoining plots.

The presence of a gradient does not demonstrate that a route is inaccessible, unsafe or unsuitable for cycling. It indicates a condition requiring more detailed assessment. Accessibility depends on grade, crossfall, surface condition, ramp length, landings, obstructions, shade, drainage, maintenance, traffic conflict and the needs of particular users. Transport performance also cannot be inferred solely from topography because travel demand, network connectivity, land-use intensity, service frequency and safety conditions matter.

Google’s measurement guidance states that distance and area results do not account for changes in elevation. A plan-view distance is therefore not necessarily the distance travelled over terrain. The productive workflow is sequential: draw and compare routes; inspect profiles and visible interruptions; overlay authoritative rights of way, transit, crash, drainage and land-use data; undertake field observation; then use surveyed data and applicable design standards for formal decisions.

Source: Google Earth release notes.

Measurement limitation source: Google Earth measurement guidance.

Suggested photograph: Digital elevation model and hillshade visualisation of the Great Black Swamp, showing terrain-derived landform patterns.

Image link:https://upload.wikimedia.org/wikipedia/commons/0/0a/Great_Black_Swamp_USGS_DEM_aspect_map_Hillshade_Stretched.jpg

Suggested caption: Route analysis must consider vertical change as well as plan distance and network connection.

Credit: GeoFAXsafety79, CC0 1.0 Universal Public Domain Dedication. Attribution is not legally required but should be retained editorially.

Historical imagery and change detection provide evidence of change not proof of cause

Historical imagery shifts the question from what is there to what appears to have changed, when and under what conditions. Google states that its historical imagery includes global satellite imagery since 1984 and aerial imagery as early as the 1930s for some cities. Availability, date range and resolution vary significantly by location, so this is a platform-level capability rather than a guarantee for every site.

Google explains that satellite and aerial images are collected at a particular date and time, but a displayed image may be a composite. Three-dimensional imagery does not display a collection date because aerial images may be collected over multiple dates. A user should therefore not infer that every object visible in a 3D scene existed simultaneously. Image comparison alone cannot establish the date, authorisation or cause of land-use change.

The experimental Detect Change function, announced in September 2026, compares Earth-observation data across two annual intervals and produces a 10-metre-resolution heatmap identifying locations where surface change appears to have occurred. It can rapidly direct attention to possible construction activity, vegetation loss, erosion, shoreline change or expansion at the metropolitan edge. It is a triage tool, not a substitute for change classification, planning-enforcement evidence, environmental monitoring or land-record verification.

A defensible case study combines three inquiries: historical imagery identifies an apparent transformation; records, authoritative datasets or field observation test it; and interviews or institutional evidence may explain the decisions behind it. A before-and-after image may show sequence, but temporal coincidence is not proof of causation.

Imagery source: Google Earth imagery-collection guidance.

Suggested photograph: Digital elevation model and hillshade visualisation of the Great Black Swamp, showing terrain-derived landform patterns.

Image link:https://upload.wikimedia.org/wikipedia/commons/0/0a/Great_Black_Swamp_USGS_DEM_aspect_map_Hillshade_Stretched.jpg

Suggested caption: Change interpretation should connect visible surface change with terrain, drainage and independently verified records.

Credit: GeoFAXsafety79, CC0 1.0 Universal Public Domain Dedication. Attribution is not legally required but should be retained editorially.

Geospatial data layers should broaden not narrow professional judgement

Google Earth increasingly brings project data and contextual datasets into the same visual environment. Its data catalogue includes elevation contours, administrative boundaries and selected environmental and demographic layers, with availability varying by plan and geography. This can reduce information fragmentation. A transport planner may hold stop locations and service routes; an urban designer may work with parcels and public-realm proposals; an environmental consultant may hold flood or habitat layers; and a municipal agency may maintain zoning and infrastructure records.
Visual integration can also produce false coherence. Layers may use different survey dates, scales, classification systems and positional accuracies. A road centreline may be adequate for metropolitan analysis but unsuitable for assigning curb locations. A population surface may support broad service-access analysis but not parcel-level social claims. A satellite-derived tree-canopy layer can assist screening but should not replace an arboricultural inventory. Every project should maintain a data register that records the source organisation, publication date, collection date, spatial resolution, attribute definitions, use restrictions and known limitations.

For high-consequence elevation decisions, authoritative national data remains essential. In the United States, the US Geological Survey 3D Elevation Program provides high-quality topographic data and three-dimensional representations of natural and constructed features through The National Map. Elsewhere, equivalent national mapping agencies, survey departments, cadastral authorities and local data custodians should be the first source for statutory mapping and survey control.

This is a robust division of labour: Google Earth provides rapid visual synthesis and collaboration; authoritative custodians provide formal datasets; surveyors establish site control; GIS and remote-sensing workflows undertake reproducible analysis; and fieldwork tests informal access, temporary obstructions and lived conditions.

Authoritative elevation-data example: USGS 3D Elevation Program.

Suggested photograph: Digital elevation model and hillshade visualisation of the Great Black Swamp, showing terrain-derived landform patterns.

Image link:https://upload.wikimedia.org/wikipedia/commons/0/0a/Great_Black_Swamp_USGS_DEM_aspect_map_Hillshade_Stretched.jpg

Suggested caption: Geospatial layers gain value when their sources, dates, scales and limitations remain visible to the project team.

Credit: GeoFAXsafety79, CC0 1.0 Universal Public Domain Dedication. Attribution is not legally required but should be retained editorially.

A defensible workflow for architecture planning and research

A rigorous workflow begins with an analytical question, not software. The question may concern flood exposure, pedestrian accessibility, terrain suitability, development pressure, heat exposure or heritage setting. It determines which layers are relevant and which claims can reasonably be made.

Create a transparent base project containing the study boundary, imagery date, parcel or corridor geometry, coordinate information and a brief description of each imported dataset. Use the platform to generate exploratory evidence: measurements, terrain profiles, contours, slope and aspect maps, historical-image comparisons and data overlays. Record the interpretation as a hypothesis rather than a settled fact. For example, the statement that a northern edge appears to receive overland flow from higher ground must be tested through contour information, drainage mapping, rainfall evidence and field inspection.

Verify high-consequence issues using primary evidence: cadastral records for ownership, survey data for grade and boundaries, engineering data for drainage and utilities, traffic counts for transport performance, field surveys for vegetation and ground conditions, and statutory mapping for planning controls. Preserve an audit trail by identifying imagery-viewing dates, imported layers, processing choices, field dates and uncertainties.

For research, this workflow protects against overclaiming. Google Earth can support systematic visual interpretation and help locate cases, but it does not independently validate causal explanation. If a study associates a new road with urban expansion, it must consider alternative explanations including zoning, land-market change, infrastructure extension, population growth and prior development pressure. The most useful tools are those that improve the questions asked before design or policy choices harden into commitments.
Suggested photograph: Digital elevation model and hillshade visualisation of the Great Black Swamp, showing terrain-derived landform patterns.

Image link:https://upload.wikimedia.org/wikipedia/commons/0/0a/Great_Black_Swamp_USGS_DEM_aspect_map_Hillshade_Stretched.jpg

Suggested caption: A defensible site-analysis workflow treats terrain outputs as evidence to verify, not as final design instruction.

Credit: GeoFAXsafety79, CC0 1.0 Universal Public Domain Dedication. Attribution is not legally required but should be retained editorially.

Conclusion

Google Earth’s 2026 tools expand what can be explored at the desk: site-specific contours, slope, aspect, approximate cut and fill, route elevation profiles, historical imagery, change detection and direct import of common geospatial formats. These functions can make early-stage analysis faster, more collaborative and more transparent.

Their limitation is equally important. The platform can reveal patterns and generate hypotheses, but it does not create survey-grade certainty, establish legal conditions or prove causation. The most defensible use of Google Earth is as a bridge between visual reconnaissance and verified spatial evidence. Used with authoritative datasets, fieldwork, survey control and clear documentation, it can improve professional judgement. Used as a substitute for them, it can produce precise-looking but unreliable conclusions.

Suggested photograph: Digital elevation model and hillshade visualisation of the Great Black Swamp, showing terrain-derived landform patterns.

Image link:https://upload.wikimedia.org/wikipedia/commons/0/0a/Great_Black_Swamp_USGS_DEM_aspect_map_Hillshade_Stretched.jpg

Suggested caption: Digital terrain tools are most valuable when they guide verification, rather than replace it.

Credit: GeoFAXsafety79, CC0 1.0 Universal Public Domain Dedication. Attribution is not legally required but should be retained editorially.

References and Further Reading

Related reading on Urban Design Lab: Best Free Datasets for Urban Designers and GIS Users; Free GIS Data Portals Every Architecture and Planning Student Should Know

Leave a Reply

Your email address will not be published. Required fields are marked *

This site uses Akismet to reduce spam. Learn how your comment data is processed.

Related articles

UDL Thesis Publication 2025

Call for Abstracts now open!

UDL GIS

MASTERCLASS

Urban Mapping, Analysis and Representation

Session Dates

12th-16th October, 2026

Curating the best graduate thesis projects globally!

Publish your work and get recognized globally!

Free E-Book

From thesis to Portfolio

A Guide to Convert Academic Work into a Professional Portfolio”

Urban Design Lab

Be the part of our Network

  • Stay updated on workshops, design tools, and calls for collaboration

  • Thesis Report Writing for Architecture and Urban Studies

    Join Our WhatsApp Group

    Recent Posts

    Sign up for our Newsletter

    “Let’s explore the new avenues of Urban environment together “

    E-Book- From Thesis To Portfolio

    A Guide to Convert Academic Work into a Professional Portfolio