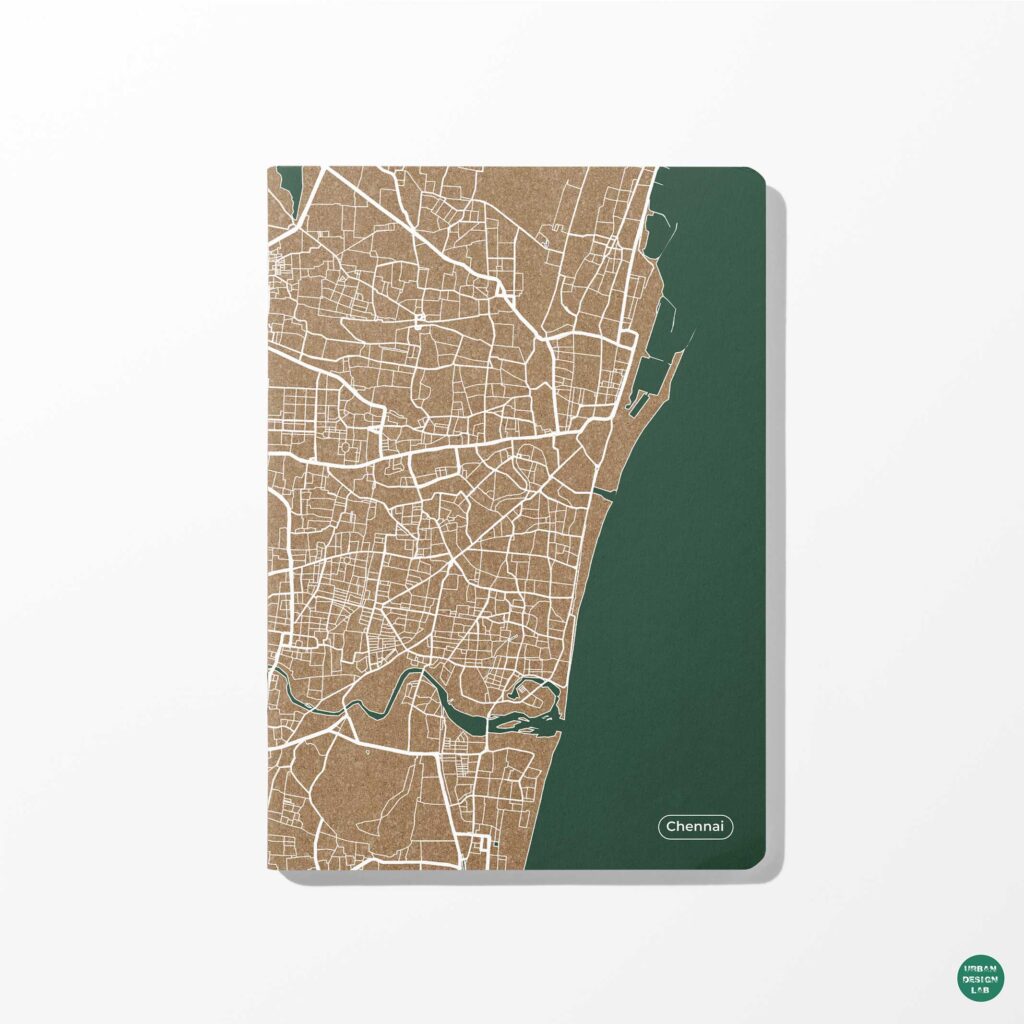
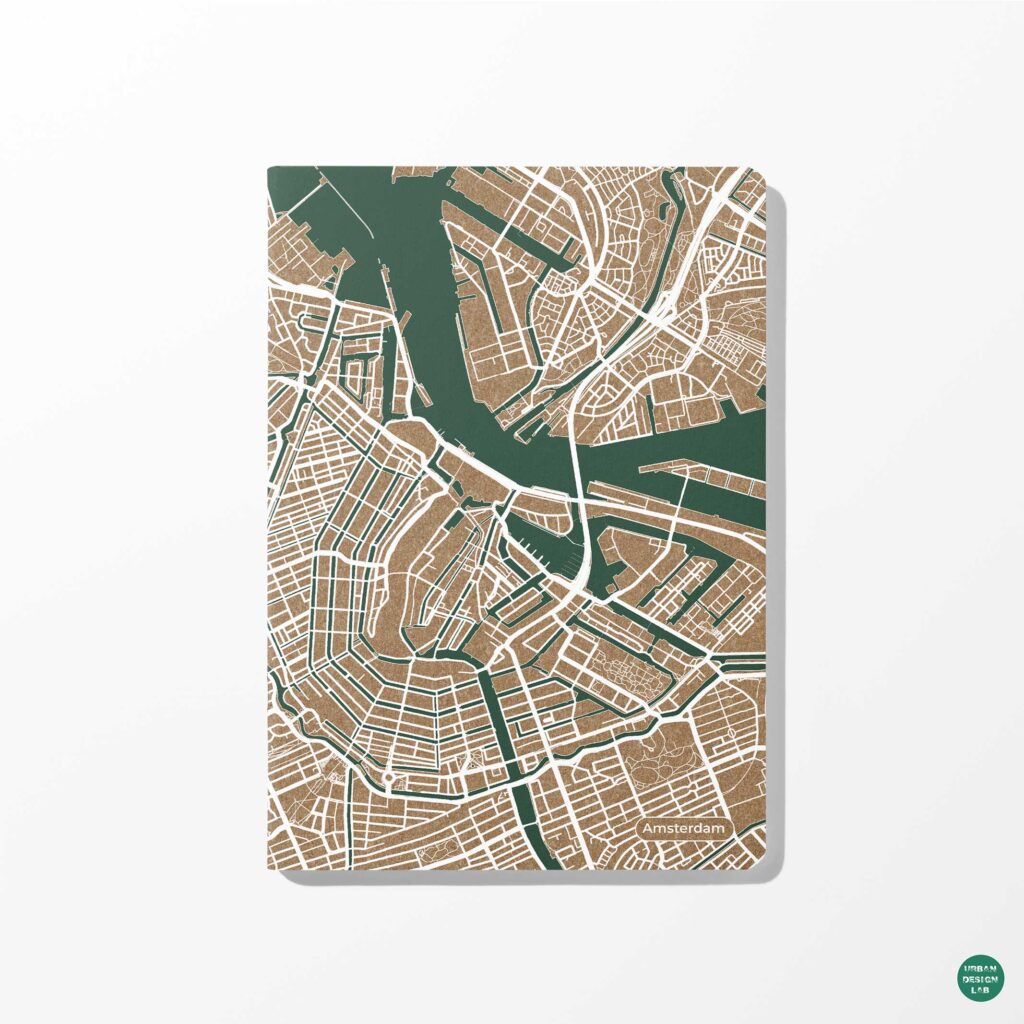
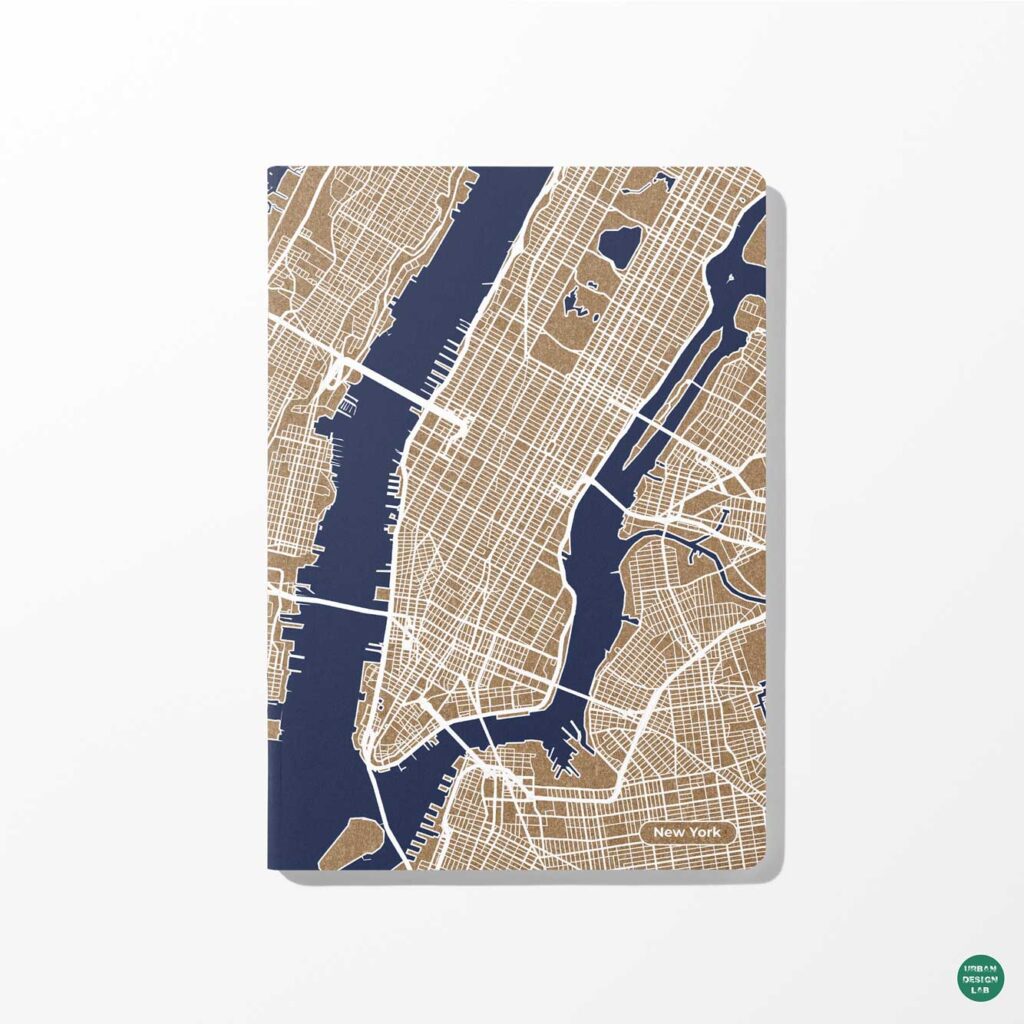
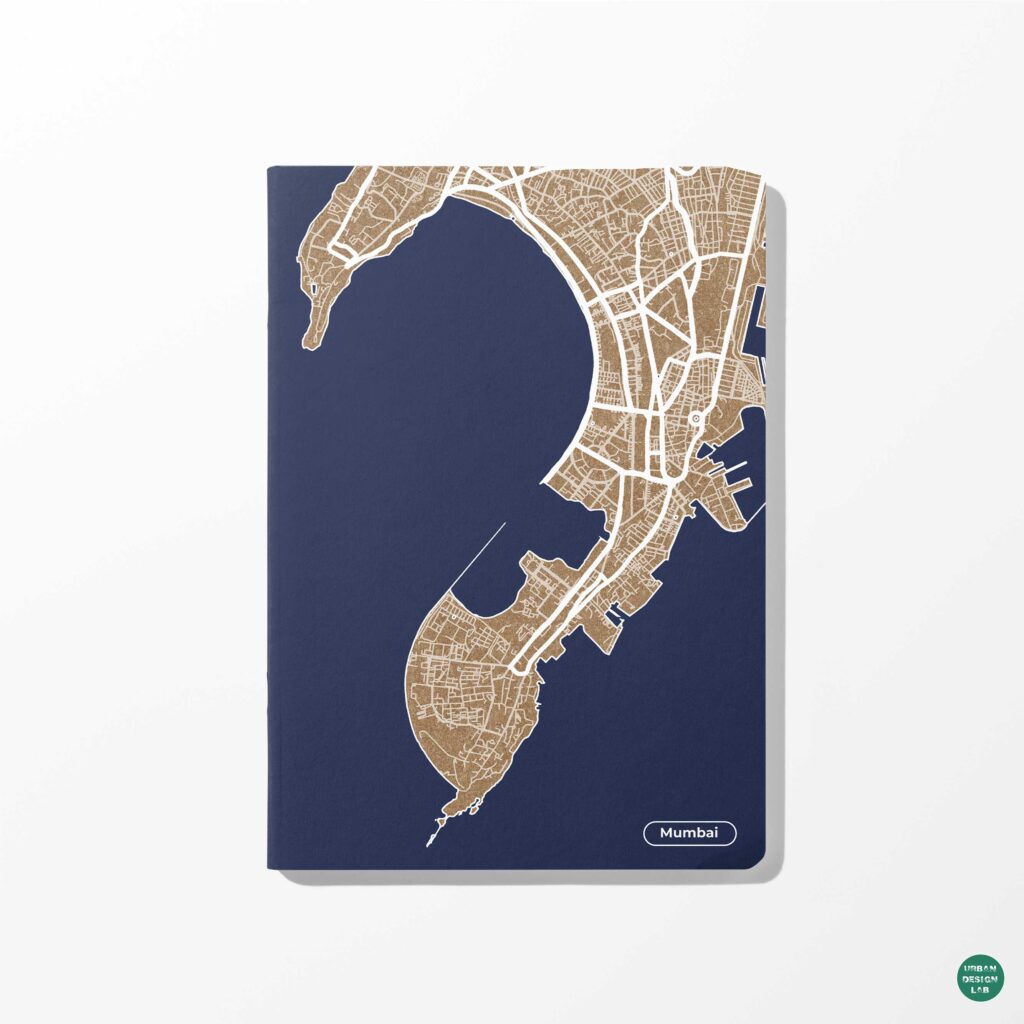
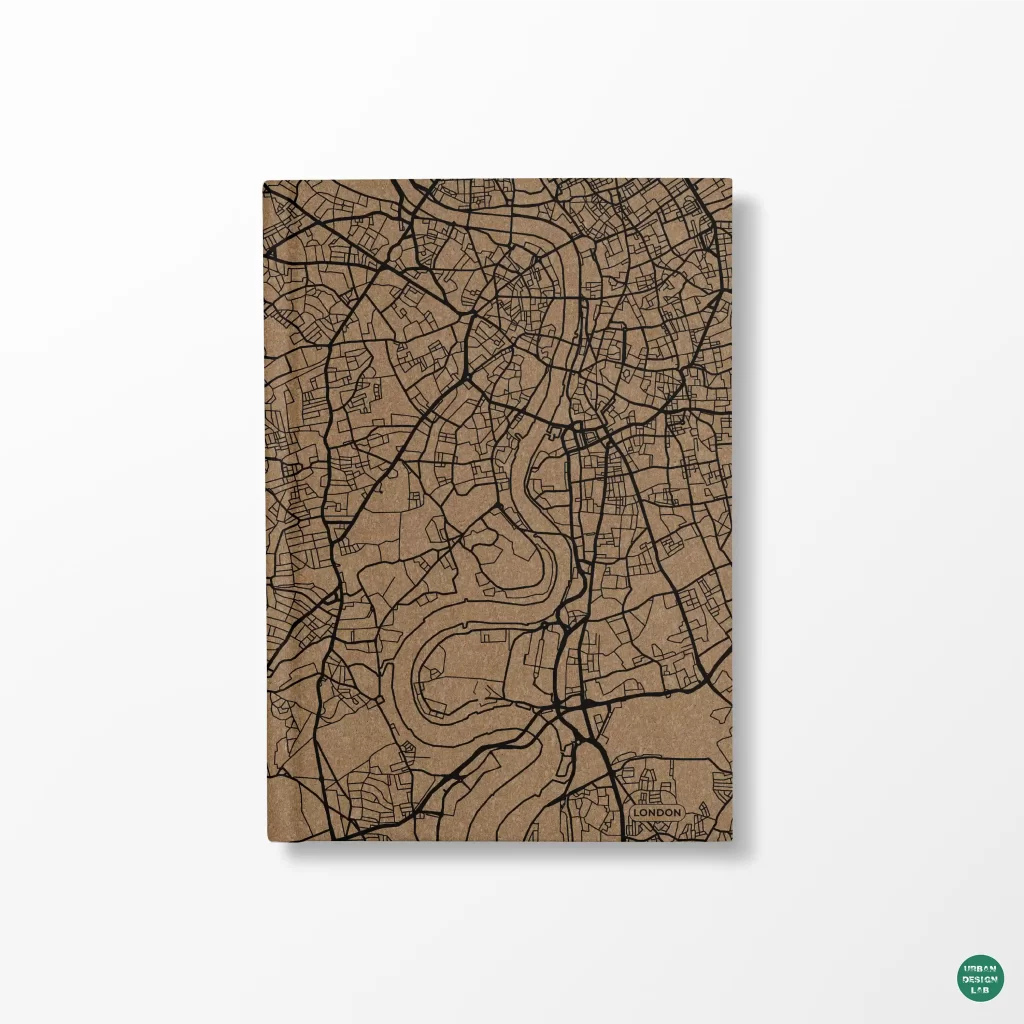
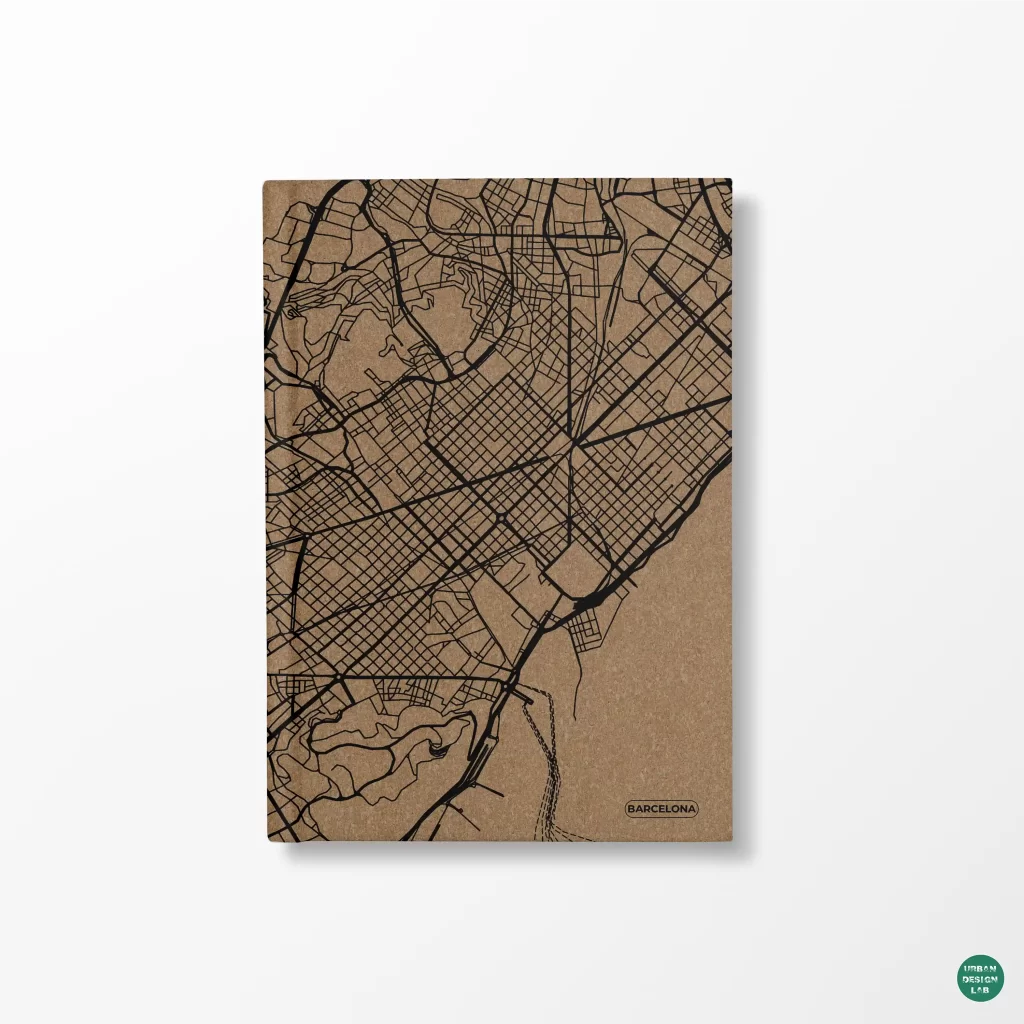
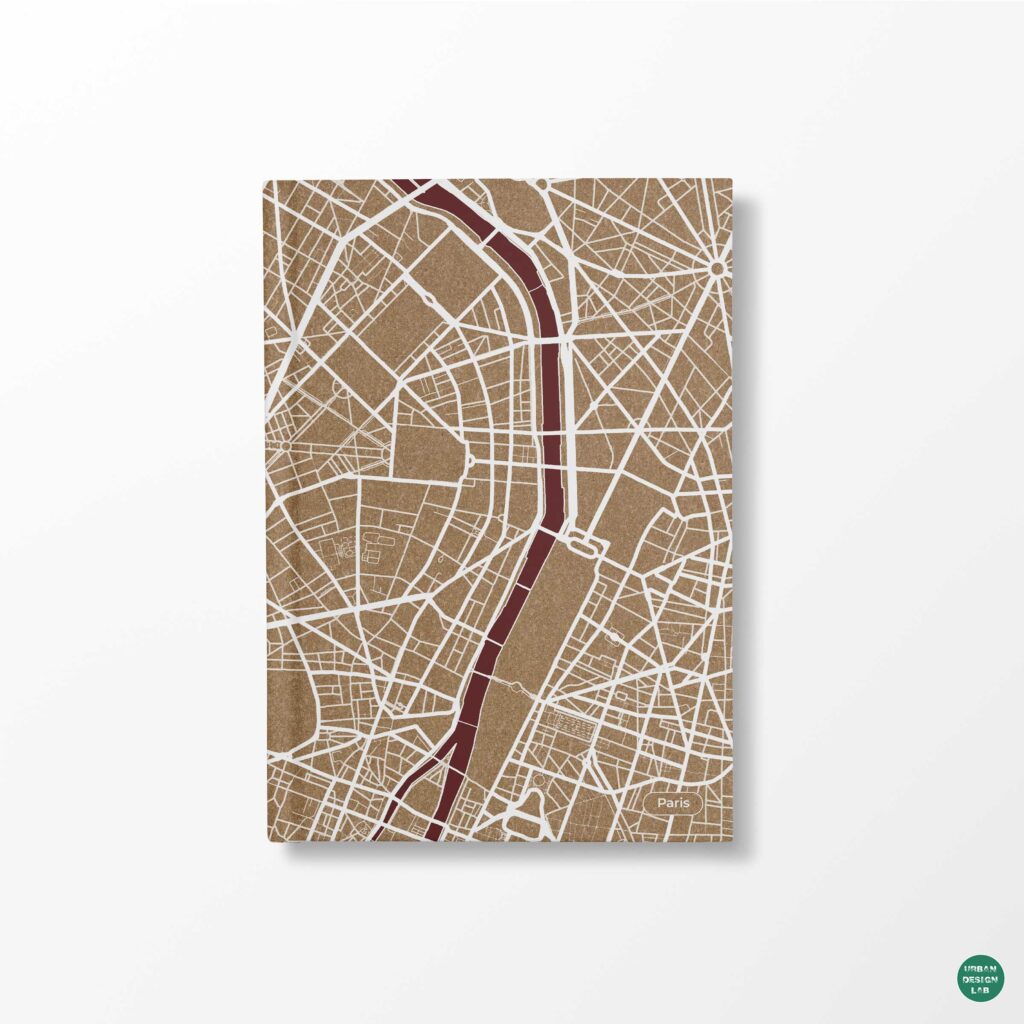
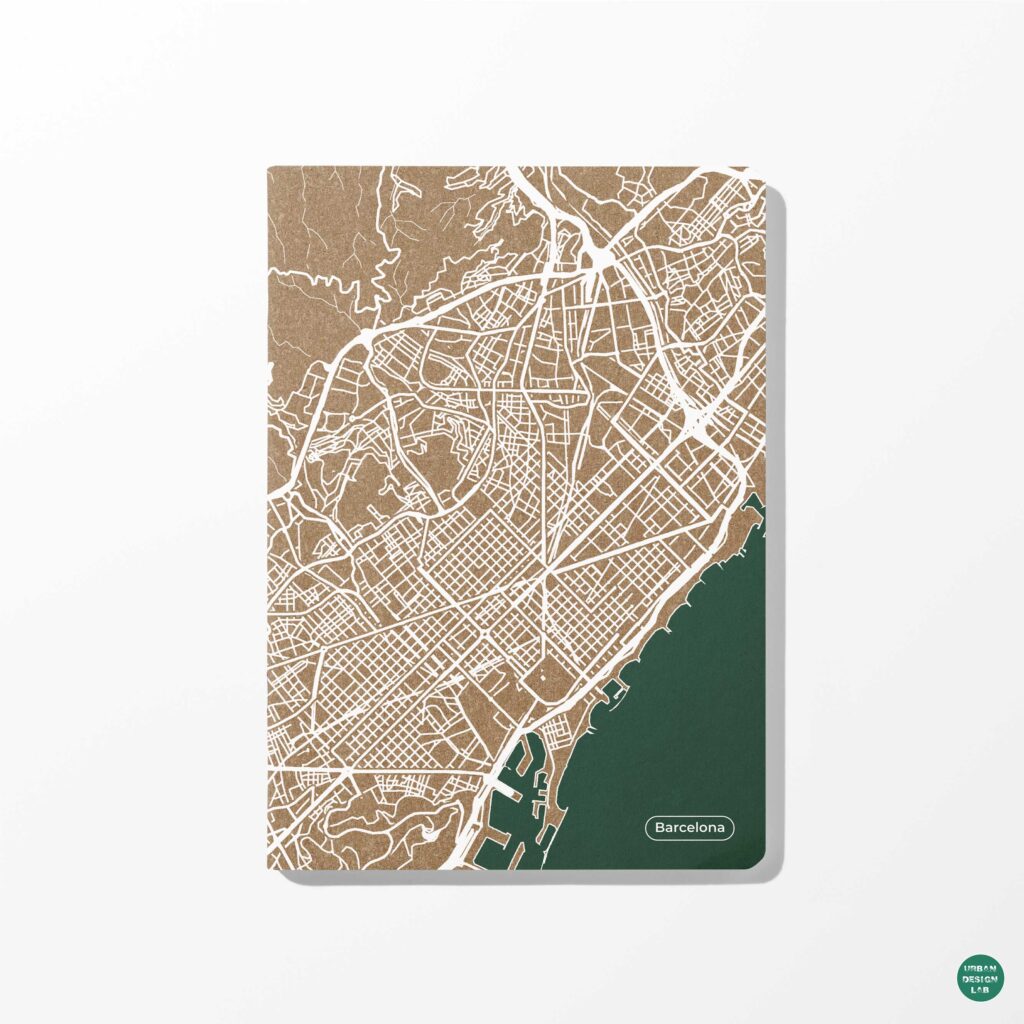
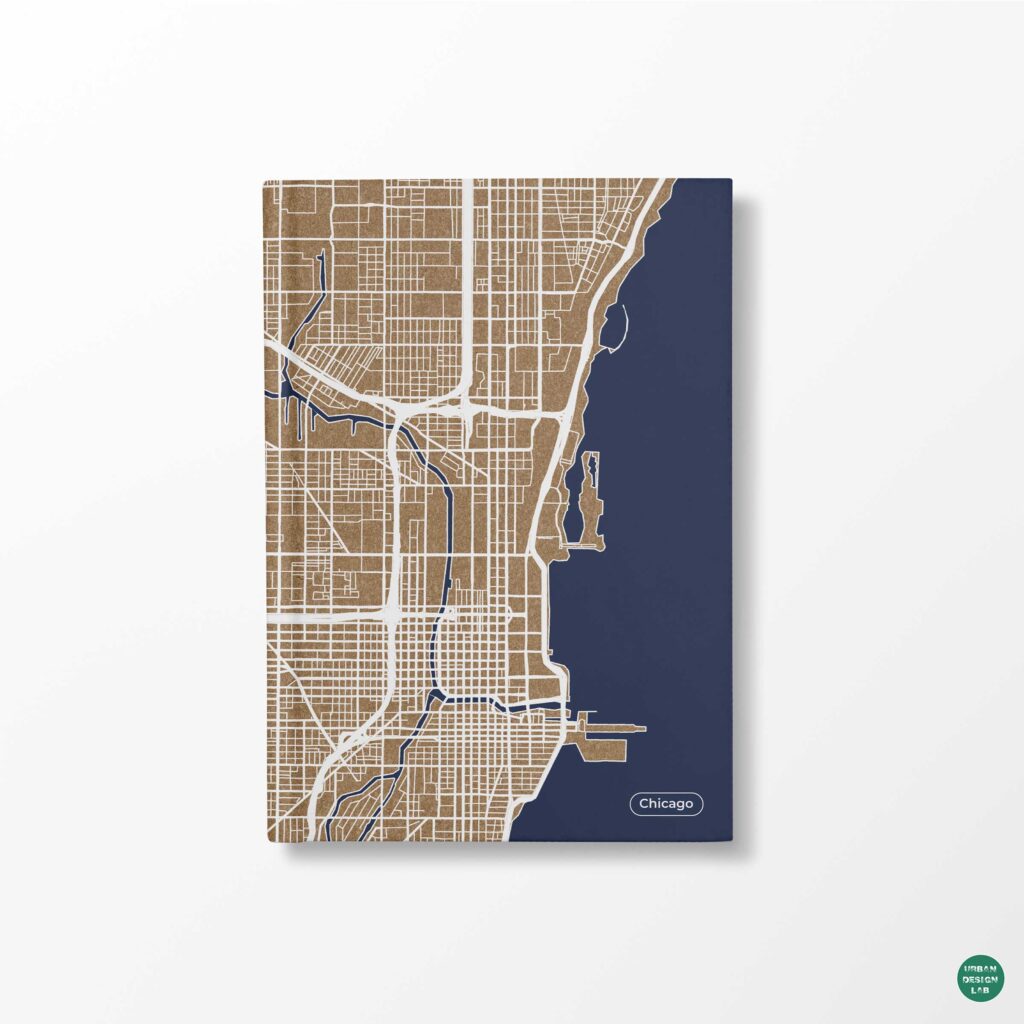
QGIS plugins used for urban design analysis on a city street network map

Urban design increasingly depends on the ability to understand cities through spatial data. From mapping street networks and evaluating pedestrian accessibility to investigating urban heat, land-use change, transport systems and public-space distribution, Geographic Information Systems (GIS) have become an important component of contemporary urban research and planning practice.

Among the available GIS platforms, QGIS provides an open-source environment for spatial data management, cartographic production, geoprocessing and geographic analysis. Its capabilities extend beyond its core tools through an ecosystem of plugins developed by researchers, software organisations and independent contributors.

According to the official QGIS documentation, plugins can introduce additional functionality into the application, including new processing algorithms, external data services, visualisation interfaces and specialised analytical workflows. However, plugins are not interchangeable, and installing more of them does not necessarily produce better urban analysis.

A plugin designed to retrieve OpenStreetMap data addresses a fundamentally different problem from one that models pedestrian catchments or estimates outdoor thermal conditions. Similarly, a tool that publishes an interactive web map cannot establish whether the data behind that map are sufficiently accurate for planning decisions.

For architects, urban designers, planners and spatial researchers, the more useful question is therefore not simply which plugins are popular, but which plugins support specific urban research questions, what assumptions their analyses depend on and how their outputs should be interpreted.

This article examines ten QGIS plugins covering geographic data acquisition, network analysis, urban environmental modelling, remote sensing, visualisation, field documentation and transport modelling. Each plugin is discussed in terms of its functionality, practical applications, workflow and limitations.

The selection is based on documented capabilities and relevance to urban design practice, rather than download rankings. Compatibility should always be checked against the installed QGIS version, particularly because several plugins have introduced different versions for QGIS 3 and QGIS 4.


Building the Spatial Foundation: OpenStreetMap and Basemap Plugins

Before undertaking urban analysis, researchers need reliable spatial information. Street centre lines, building footprints, open spaces, water bodies, administrative boundaries and points of interest commonly form the geographic foundation of an urban study.

The first two plugins simplify access to such information. Nevertheless, they perform different functions: one retrieves features that can be analysed, while the other primarily supplies geographic reference layers.

1. QuickOSM: Extract OpenStreetMap Data Directly into QGIS

Best for: Street-network mapping, building-footprint extraction, urban morphology, amenities and preliminary urban inventories.

Official plugin: QuickOSM, QGIS Plugins Repository

QuickOSM is one of the most useful extensions for urban designers working with OpenStreetMap, a collaboratively maintained geographic database.

Developed by contributors including Etienne Trimaille, QuickOSM connects QGIS with the Overpass API, allowing users to retrieve OpenStreetMap features according to their tags and geographic locations. It also supports opening local OSM and PBF files and running custom Overpass queries, as documented in its official plugin description.

OpenStreetMap features are organised through tags consisting of keys and values. For example, the key highway identifies different classes of roads and paths, while building is used for building-related features. The meaning and completeness of these tags depend on the contributors and local mapping practices.

For urban designers, QuickOSM can support several important tasks:

  • Extracting street and pedestrian networks for connectivity studies.
  • Downloading building footprints for figure-ground mapping.
  • Identifying mapped parks, schools, hospitals and public amenities.
  • Preparing preliminary urban morphology datasets.
  • Obtaining geographic features for neighbourhood mapping and visualisation.

Consider a study investigating pedestrian accessibility to public parks in Jaipur. A researcher could use QuickOSM to retrieve mapped pedestrian routes and park features within the selected study area.

The retrieved network could then be cleaned and used for network-distance analysis. However, the presence of a mapped route does not establish its quality, accessibility, safety or operational status.

Suggested workflow

Open QGIS and install QuickOSM through Plugins > Manage and Install Plugins. Open the QuickOSM interface, specify the relevant OpenStreetMap key and value, and define the geographic area.

For a preliminary building-footprint extraction, use the key building and an appropriate selection of values. For street analysis, query relevant highway categories rather than assuming that every feature tagged as a highway is suitable for walking.

Save the returned data in a persistent geospatial format such as GeoPackage before cleaning and analysis.

Important limitation

OpenStreetMap coverage is not uniform. Buildings, pedestrian crossings, informal paths and other features may be incompletely mapped. Data should be checked against authoritative records, imagery or field observations when completeness matters.

OpenStreetMap also has licensing obligations under the Open Database License. Data provenance, extraction date and attribution should be preserved.

QuickOSM is an effective starting point for building an urban database, but it is not a substitute for survey verification.

2. QuickMapServices: Add Geographic Context to Urban Maps

Best for: Basemap integration, spatial orientation, preliminary site studies and comparing geographic reference services.

Official plugin: NextGIS QuickMapServices

NextGIS QuickMapServices simplifies the process of discovering and adding online basemaps and geospatial services to QGIS.

According to its official repository description, the plugin connects users to a catalogue of geographic services, including OpenStreetMap-based basemaps, satellite imagery and other reference layers.

For urban mapping, this can reduce the time spent locating and manually configuring compatible web services.

An urban designer preparing a site analysis may need to understand the relationship between a project boundary, major roads, neighbouring developments, water bodies and surrounding settlements.

QuickMapServices allows geographic reference layers to be added quickly and compared within the same QGIS project.

Its applications include preparing contextual mapping for architectural sites, examining settlement patterns, reviewing road-network relationships and supporting initial geographic reconnaissance.

Suggested workflow

Install QuickMapServices through the Plugin Manager. Search the available catalogue for a suitable basemap or geographic service, and add it to the project.

Place the reference layer below the analytical data. Adjust the transparency or styling of the analytical layers so that the underlying context remains visible without overwhelming the map.

When preparing publication graphics, consider whether the chosen basemap contains unnecessary labels or colours that compete with the analytical information.

Important limitation

A basemap is not automatically an analytical dataset.

Some online basemaps are delivered as rendered image tiles rather than editable geographic features. They can support orientation without supplying road geometry, building attributes or other data required for spatial analysis.

Licensing also varies between service providers. A layer appearing in a catalogue should not be interpreted as unrestricted permission to reproduce it in commercial publications, printed maps or downloadable datasets.

For analytical work, QuickMapServices should complement verified vector and raster datasets rather than replace them.

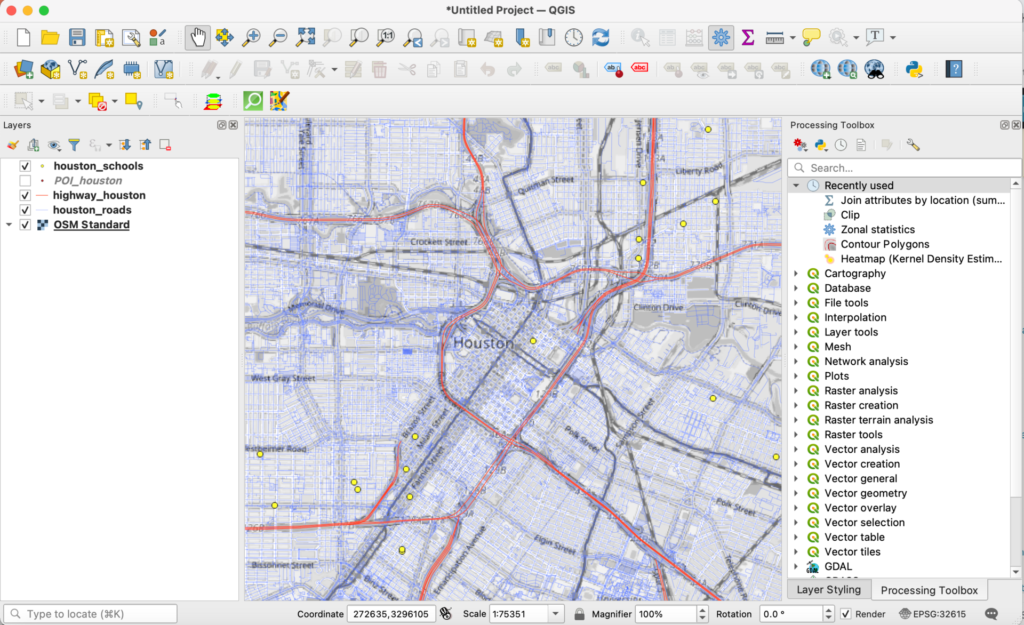
QGIS interface displaying roads, highways, schools and an OpenStreetMap basemap in Houston
Combining geographic reference layers with analytical features creates the spatial foundation for urban mapping, but the sources and reliability of each layer must be evaluated independently. Image: QGIS Development Team, CC0, via Wikimedia Commons.

Measuring Urban Accessibility and Street-Network Performance

Street networks play a fundamental role in connecting neighbourhoods, public spaces, transport facilities and everyday destinations.

However, geographic proximity does not necessarily imply accessibility. Two locations may be close in straight-line distance yet separated by railway lines, rivers, restricted compounds or disconnected streets.

Network-based analysis provides an alternative by measuring movement along the available connections.

The following plugins support route calculations, catchment analysis and origin-destination relationships. Their outputs are useful for investigating spatial accessibility, although they cannot independently establish the complete pedestrian experience.

3. QNEAT3 and QNEAT: Analyse Street Networks and Service Areas

Best for: Walkability analysis, shortest-path calculations, pedestrian catchments and origin-destination matrices.

Official plugins: QNEAT3 for QGIS 3 and QNEAT for QGIS 4

QNEAT is a network-analysis toolbox developed by Clemens Raffler.

The QNEAT3 plugin introduced additional network-analysis algorithms within the QGIS Processing framework. Its documented functions include shortest-path solving, service-area or Iso-Area generation and origin-destination matrix calculations.

An important compatibility distinction exists: the QNEAT3 repository lists compatibility with QGIS 3, while the newer QNEAT plugin provides the corresponding toolbox for QGIS 4.

For urban designers, this type of analysis is particularly relevant to walkability and public-facility accessibility.

Consider an investigation into neighbourhood access to primary schools. A basic map might show schools alongside circular distance buffers. However, circular buffers assume unrestricted movement in every direction and do not account for actual street connections.

A network-based service-area analysis instead evaluates reachable distances along the available network.

Such an analysis can help identify residential areas located beyond a selected network-distance threshold.

The same approach can be applied to parks, transit stations, healthcare facilities, neighbourhood centres and public amenities.

Suggested workflow

Begin with a cleaned and connected street-network layer. Select the relevant pedestrian links and remove routes that are not genuinely accessible.

Confirm that the geometry uses an appropriate coordinate reference system and distance units.

Next, prepare the destination points, such as public parks or bus stops.

Use the relevant QNEAT processing algorithm to calculate network-based service areas or distances.

The result can be mapped against residential areas or population data to investigate differences in estimated accessibility.

Important limitation

Network-analysis results depend heavily on the construction of the network.

Disconnected line segments, incorrect intersections, missing pedestrian connections and inappropriate movement assumptions can produce misleading outputs.

Moreover, shortest distance is not equivalent to pedestrian comfort.

A route may be short but lack shade, safe crossings, continuous footpaths or universal accessibility.

For defensible walkability research, network results should be interpreted alongside field observations and additional variables describing street conditions.

4. ORS Tools: Calculate Routes, Travel Times and Isochrones

Best for: Travel-time accessibility, mobility comparisons, routing and geographic service areas.

Official plugin: ORS Tools

ORS Tools connects QGIS with openrouteservice, a routing service developed within the HeiGIT ecosystem.

The official plugin documentation identifies routing, isochrone and matrix calculations among its main functions.

Although these capabilities overlap with network-analysis plugins such as QNEAT, the underlying workflow differs. ORS Tools can obtain results from an external routing service rather than requiring every network computation to be constructed locally.

This can be useful when preparing accessibility analyses across larger geographic areas or comparing different travel modes supported by the service.

An isochrone represents the area that can be reached within a specified travel time under the chosen routing assumptions.

For example, urban designers may investigate which neighbourhoods fall within an estimated walking-time catchment of a transit station.

Similarly, an origin-destination matrix can estimate travel time or distance between multiple origins and destinations.

These results can contribute to public-facility location studies, transit accessibility assessments and comparisons between alternative service locations.

Suggested workflow

Install ORS Tools and configure the required openrouteservice authentication credentials.

Prepare the origin locations, destination locations or points of interest.

Select the appropriate travel profile and analytical operation.

For a transit-accessibility study, calculate walking-time isochrones around selected stations, then compare the resulting coverage with residential distribution or other relevant geographic indicators.

Document the travel profile, request parameters and service date so that the analysis can be interpreted and, where feasible, repeated.

Important limitation

The routing service depends on underlying geographic data and routing assumptions. It does not continuously observe actual journeys.

Estimated travel time can differ from experienced travel time because of congestion, pedestrian delay, crossing conditions, weather, road restrictions and other circumstances.

API usage is also subject to the provider’s current access conditions and rate limits, which should be checked through the official openrouteservice documentation.

ORS Tools is useful for modelling accessibility, but conclusions about mobility equity or real-world pedestrian conditions require additional evidence.

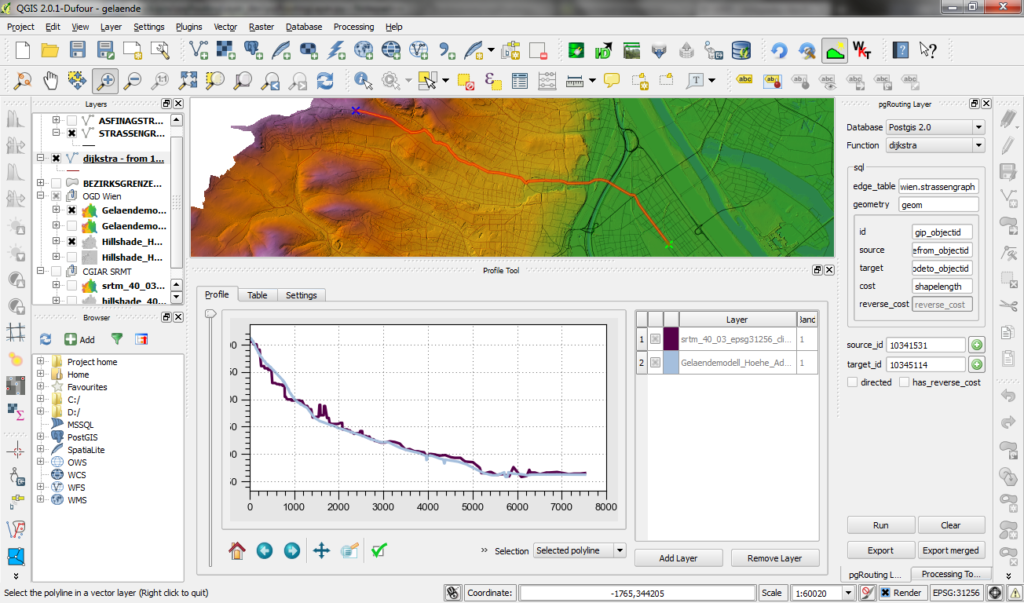
Historic QGIS screenshot showing a routed network alongside terrain information and an elevation profile
Network-based analysis can connect route geometry with measurable characteristics such as travel distance and elevation, although the result depends on the quality and assumptions of the underlying network model. Image: underdarkGIS, CC BY-SA 2.0, via Wikimedia Commons.

Understanding Urban Climate and Environmental Change

Environmental analysis is becoming increasingly important in urban design because the built environment influences radiation exposure, shading, surface properties, vegetation distribution and local microclimatic conditions.

Geospatial tools can support such investigations, but different environmental variables must not be confused.

For example, remotely sensed land-surface temperature is not the same measurement as near-surface air temperature, and neither alone fully describes human thermal comfort.

The following plugins represent two complementary approaches: physically oriented urban environmental modelling and the classification of satellite imagery.

5. UMEP: Model Urban Climate, Radiation and Thermal Conditions

Best for: Outdoor thermal environments, shadow analysis, solar exposure and climate-sensitive urban design.

Official plugin: UMEP

UMEP stands for Urban Multi-scale Environmental Predictor.

The plugin ecosystem has been developed through collaboration involving the University of Gothenburg, the University of Helsinki and the University of Reading.

According to the official QGIS plugin repository, UMEP supports urban climate research through preprocessing, modelling and post-processing functions.

A related extension, UMEP for Processing, integrates environmental modelling tools within the QGIS Processing framework.

One significant component is SOLWEIG, a model used to estimate spatial variations in radiation fluxes and mean radiant temperature in complex urban settings.

The official SOLWEIG documentation describes its treatment of shortwave and longwave radiation, meteorological inputs and urban geometry.

Mean radiant temperature is particularly relevant to outdoor thermal environments because it reflects the radiative exchanges experienced by a person.

For an urban designer, UMEP can support the investigation of questions such as whether building arrangements provide adequate shade, how urban geometry affects radiation exposure and where design interventions may alter modelled outdoor conditions.

Consider a public-space redesign in a densely built neighbourhood.

A research team could prepare an appropriate three-dimensional representation of the surrounding urban form and vegetation, provide the required meteorological inputs, and model the radiation environment under specified conditions.

Alternative arrangements of buildings or shading elements could then be evaluated as scenarios.

The resulting maps may assist comparative design assessment, provided the assumptions and uncertainty of the model are reported.

Suggested workflow

Begin by preparing suitable urban-geometry datasets, including building heights and terrain information where required by the selected model.

Check the model documentation for meteorological inputs, spatial resolution, processing dependencies and coordinate requirements.

Construct a baseline scenario reflecting documented existing conditions.

Run the chosen UMEP model and examine the relevant spatial outputs.

Develop alternative design scenarios and compare them against the baseline using consistent meteorological and modelling assumptions.

Important limitation

Environmental model outputs are not direct substitutes for field measurements.

Their reliability depends on input accuracy, model assumptions, spatial resolution and validation.

A simulation can estimate how a design might influence radiation or thermal conditions under specified circumstances; it cannot, by itself, establish the actual comfort experienced by all users.

Certain UMEP tools also require additional Python libraries. Compatibility and installation requirements should be checked through the official UMEP documentation.

6. Semi-Automatic Classification Plugin: Map Urban Land Cover from Satellite Imagery

Best for: Land-cover classification, urban expansion studies, vegetation mapping and remote-sensing analysis.

Official plugin: Semi-Automatic Classification Plugin

The Semi-Automatic Classification Plugin, commonly called SCP, is developed by Luca Congedo.

It supports satellite-image acquisition, preprocessing, supervised classification and post-processing. Its official repository documentation identifies Landsat and Sentinel-2 imagery among supported data sources.

For urban researchers, SCP is relevant because satellite imagery contains spectral information that can be used to classify broad categories of land cover.

Depending on the classification scheme and available training data, these categories may include built-up areas, vegetation, exposed surfaces and water.

The resulting land-cover maps can support investigations into urban expansion, vegetation change and the spatial distribution of different surface types.

For example, a research project examining development along an urban fringe could classify satellite images from two comparable periods.

The resulting maps could be used to estimate changes between mapped land-cover categories.

However, differences in season, atmospheric conditions, sensor characteristics and classification accuracy must be considered before treating the mapped differences as actual urban transformation.

Suggested workflow

Begin by defining a clearly documented land-cover classification scheme.

Select satellite imagery appropriate to the study area’s size, period and required spatial resolution.

Preprocess the imagery as required, including relevant cloud masking and band preparation.

Prepare representative training samples for the selected classes and use an appropriate supervised classification method.

Reserve independent reference observations for validation rather than using all available samples for training.

Evaluate classification accuracy and inspect spatial errors before calculating area statistics or comparing different periods.

Important limitation

A classified image is an interpretation of spectral measurements, not a direct inventory of every urban activity.

Built-up land cover cannot automatically distinguish residential, commercial, institutional and industrial uses without additional evidence.

Likewise, vegetation cover does not establish whether a green space is publicly accessible.

Classification uncertainty should be reported, particularly when comparing multiple dates.

There is also an important version issue: the SCP repository lists version 9 for the QGIS 4 transition, while earlier 8.x releases remain relevant for compatible QGIS 3 installations. The plugin also requires additional dependencies.

Researchers should use the version supported by their QGIS installation and document it in their methodology.

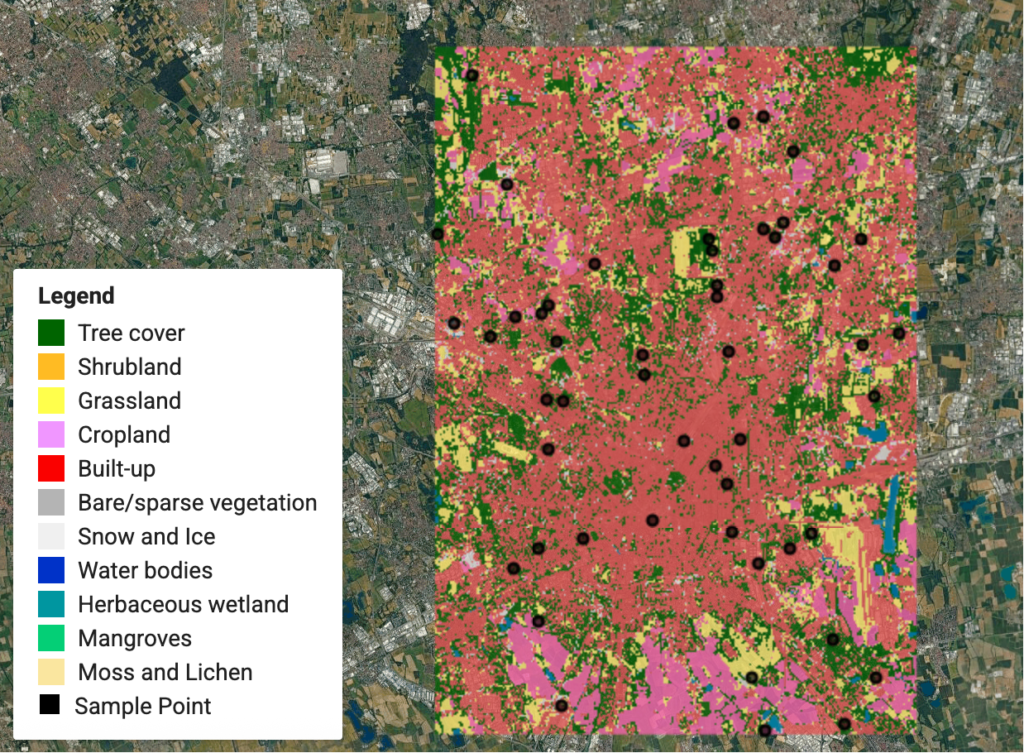
Land-cover classification map showing built-up surfaces, vegetation categories and reference sampling points over satellite imagery
Satellite-derived land-cover classification supports the study of urban surfaces, but training data, reference samples and validation are essential to interpreting mapped categories. Image: Qiongjx, CC BY-SA 4.0, via Wikimedia Commons.

Communicating Urban Data Through Charts and Interactive Maps

Spatial research produces more than maps.

A neighbourhood study may generate land-use statistics, accessibility measurements, building-density distributions, demographic indicators and relationships between different urban variables.

Some findings are best understood through geographic distribution, while others require statistical charts.

The next two plugins address this communication challenge by connecting geographic information with statistical visualisation and web-based mapping.

7. Data Plotly: Create Statistical Visualisations Within QGIS

Best for: Comparative urban statistics, charts, data exploration and analytical presentations.

Official plugin: Data Plotly

Data Plotly integrates interactive statistical charts into QGIS.

According to its official project repository, the plugin uses the Plotly library to create visualisations connected to the QGIS map canvas.

It supports different chart types, including scatter plots, histograms, bar charts and box plots.

This integration is useful because urban research often requires simultaneous examination of geographic patterns and numerical relationships.

Consider a study comparing building density with mapped public-space availability across neighbourhoods.

A choropleth map could display the geographic distribution of a selected density measure, while a scatter plot could show the relationship between density and open-space provision.

A statistical graphic may reveal clusters or outliers that are less apparent when examining the map alone.

Similarly, box plots can help compare distributions across categories such as neighbourhood types or planning zones.

However, an observed statistical association should not be interpreted as causal evidence without an appropriate research design.

Suggested workflow

Prepare a vector layer containing the relevant geographic units and numerical attributes.

Verify the attribute field types, units, null values and denominators.

Open Data Plotly and select an appropriate chart type.

Choose the attributes to be represented and configure the chart labels and styling.

Compare the resulting chart with the spatial distribution shown in QGIS, looking for outliers, uneven distributions or relationships that warrant further investigation.

Where supported, use the connection between the chart and map canvas to explore the geographic location of selected observations.

Important limitation

Data Plotly is a visualisation interface, not a statistical validation system.

A scatter plot does not establish causation, and a visually clear relationship can still result from inappropriate aggregation, omitted variables or data-quality problems.

For comparative urban research, charts should identify their units and sources, and statistical conclusions should be supported by suitable methods.

Some plugin processing features may require additional Python dependencies, as noted in the Data Plotly documentation.

8. qgis2web: Publish Interactive Urban Maps

Best for: Online urban maps, research dissemination, public communication and interactive project presentations.

Official plugin: qgis2web

qgis2web allows users to export QGIS projects into interactive web maps.

The official plugin repository explains that it supports web mapping through OpenLayers and Leaflet and attempts to reproduce project layers, extents and styles.

For GeoJSON-based output, the plugin can generate a web map without requiring server-side GIS software.

This makes it relevant to urban designers who want audiences to explore spatial information rather than viewing only static images.

For example, a neighbourhood analysis might include layers showing streets, public facilities, open spaces and selected redevelopment sites.

An interactive map could allow readers to turn thematic layers on or off and inspect available feature information.

Such an interface may be useful for communicating research findings to students, professional collaborators or public audiences.

However, the act of making a map interactive does not increase the accuracy or representativeness of the underlying data.

Suggested workflow

Prepare the QGIS project using a limited number of clearly labelled and appropriately styled layers.

Remove unnecessary attributes and verify which information should be publicly displayed.

Open qgis2web and choose the supported export framework suited to the project.

Configure the visible layers, pop-ups, map extent and available interactive controls.

Generate the web-map output and inspect it in a browser.

Test performance, appearance and interaction on both desktop and mobile screens.

Important limitation

Not every QGIS symbol, expression or layout effect necessarily translates identically into web mapping.

Large datasets can also lead to slow loading, particularly when substantial geometry is exported directly as GeoJSON.

Publication introduces additional responsibilities. Sensitive survey information, identifiable private observations or restricted datasets should not be exposed through public feature attributes.

Researchers must also review the licensing terms of the geographic data and basemaps used in the published application.

For larger or frequently updated datasets, a more structured web-GIS architecture may be appropriate.

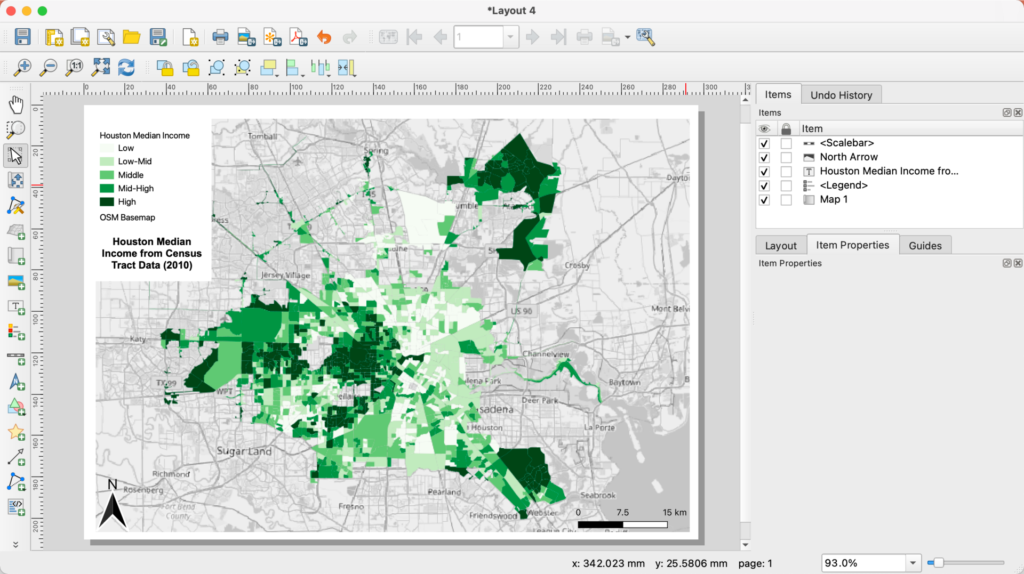
QGIS print-layout interface displaying a thematic map of neighbourhood-level income categories
Urban indicators can be communicated through thematic mapping, while complementary statistical charts and interactive interfaces allow readers to investigate values and spatial relationships in different ways. Image: QGIS Development Team, CC0, via Wikimedia Commons.

Connecting Field Surveys with Advanced Transport Modelling

Urban spatial analysis becomes more useful when geographic datasets are connected with observations and operational knowledge.

A mapped road may not have a functioning footpath. A reported public-space boundary may contain inaccessible areas. A transport network may identify available routes without describing actual travel demand or congestion.

The final two plugins address different parts of this evidence gap.

Mergin Maps supports the collection and management of geographic information from field surveys, while QAequilibraE provides tools for more advanced transportation modelling.

9. Mergin Maps: Connect Field Surveys with QGIS Projects

Best for: Urban field documentation, asset inventories, spatial surveys and collaborative geographic data collection.

Official plugin: Mergin Maps

Mergin Maps connects QGIS projects with a mobile geographic data-collection and synchronisation system.

Developed by Lutra Consulting and contributors, the plugin supports uploading and synchronising QGIS project data through the Mergin Maps service.

The official plugin documentation describes its integration with mobile field surveys, offline data collection, project versioning and synchronisation.

This has direct relevance to urban design research, where spatial databases often need to be supplemented by site-level observations.

A researcher investigating pedestrian infrastructure might need to document missing footpaths, damaged pavement, street obstructions, crossing facilities and the condition of public spaces.

A field-data collection system allows these observations to be recorded as structured geographic features instead of scattered notes or unreferenced photographs.

For collaborative projects, multiple surveyors may work on different areas before synchronising their contributions with the shared project.

Suggested workflow

Prepare a survey project in QGIS using a suitable GeoPackage and carefully designed attribute fields.

Define what each observation represents and establish consistent classifications.

For a footpath-condition survey, fields might include feature type, observed condition, accessibility issue, photograph reference, survey date and observation notes.

Apply appropriate constraints, mandatory fields and controlled value lists to reduce inconsistent entries.

Configure the project for Mergin Maps and synchronise it with the mobile application.

Conduct the field survey, recording geographic observations according to a common protocol.

After synchronisation, inspect the collected data in QGIS, review inconsistencies and check questionable locations before proceeding to analysis.

Important limitation

Mobile geographic positioning has variable accuracy. Buildings, trees, signal obstruction and device characteristics can affect recorded locations.

A smartphone location should not automatically be treated as survey-grade geometry.

Similarly, multiple observers may interpret categories differently without a clear field manual.

The quality of the final dataset depends on survey design, observer training, validation and data management.

Mergin Maps also involves an external synchronisation service. Data governance, privacy, storage and current subscription conditions should be evaluated before collecting sensitive field information.

10. QAequilibraE: Build and Analyse Transportation Models

Best for: Transport-network modelling, traffic assignment, travel-demand analysis and strategic mobility studies.

Official plugin: QAequilibraE

QAequilibraE is the QGIS graphical interface for the AequilibraE transportation-modelling framework.

The official repository identifies functions such as network editing, traffic assignment, synthetic gravity models and GTFS import capabilities.

These tools address transportation questions that go beyond drawing shortest paths or generating simple service areas.

For example, network analysis may determine the shortest route between two locations, while a transportation assignment model can examine how a specified set of trips might be distributed across a network under particular behavioural and network assumptions.

This distinction matters for strategic urban planning.

Questions about the consequences of new road connections, transport-network modifications or alternative travel-demand distributions require a modelling framework that can represent network costs and travel demand.

QAequilibraE can support such studies when the necessary inputs and modelling expertise are available.

The plugin also requires a specific naming clarification.

The earlier QGIS plugin named AequilibraE is marked as deprecated in the official repository, which directs users toward QAequilibraE.

Suggested workflow

Begin by defining the transport-planning question and study area.

Prepare a transport network with appropriate links, nodes, directionality and relevant attributes.

Identify or estimate the origin-destination demand data required by the selected model.

Check the network and demand inputs for internal consistency.

Configure an appropriate modelling procedure and document its assumptions.

Run the model and examine the resulting network outputs.

Compare modelled conditions against available observations or independent transport data before drawing conclusions about capacity, traffic redistribution or intervention effects.

Important limitation

Transportation modelling is not a substitute for measured travel behaviour.

Model outputs depend on network representation, travel-demand estimates, assignment assumptions, parameters and calibration.

An apparently precise traffic-volume map may still be unreliable if its input demand matrix has not been validated.

For urban-design applications, the appropriate level of modelling should be proportionate to the research question.

A small pedestrian precinct study may require detailed field observations and network analysis rather than a full strategic traffic-assignment model.

Conversely, metropolitan transport scenarios may require formal travel-demand modelling and specialist expertise beyond basic GIS mapping.

QGIS screenshot displaying major transportation networks, intermodal facilities and other geographic infrastructure layers across the United States
Integrated transportation datasets provide the spatial context for network modelling, while field observations and verified demand information are needed to assess how transport systems function. Image: Wikideas1, CC0, via Wikimedia Commons.

Conclusion

QGIS plugins can extend urban research far beyond the production of conventional maps. They allow researchers to retrieve geographic information, analyse network accessibility, investigate environmental conditions, classify satellite imagery, explore statistical relationships, publish interactive maps and connect field observations with transportation models.

However, their usefulness depends on selecting the appropriate tool for the question being investigated.

QuickOSM and QuickMapServices support geographic data preparation and orientation, but neither guarantees data completeness. QNEAT and ORS Tools provide network-based accessibility methods, yet their results depend on network quality and routing assumptions. UMEP and SCP expand environmental analysis, while requiring careful treatment of model inputs and classification uncertainty.

Data Plotly and qgis2web improve how spatial information is communicated, but visual clarity should not be confused with methodological validity. Mergin Maps helps organise field evidence, while QAequilibraE supports more specialised transportation modelling where suitable data and expertise are available.

For architects and urban designers, the strongest QGIS workflow is therefore not defined by the number of installed plugins. It is defined by a clear spatial question, appropriate geographic data, transparent methods, validated results and communication that does not exceed what the evidence can support.

Ultimately, the most valuable QGIS plugins are those that transform urban mapping from an exercise in visual representation into a reproducible process of spatial investigation and evidence-informed design.

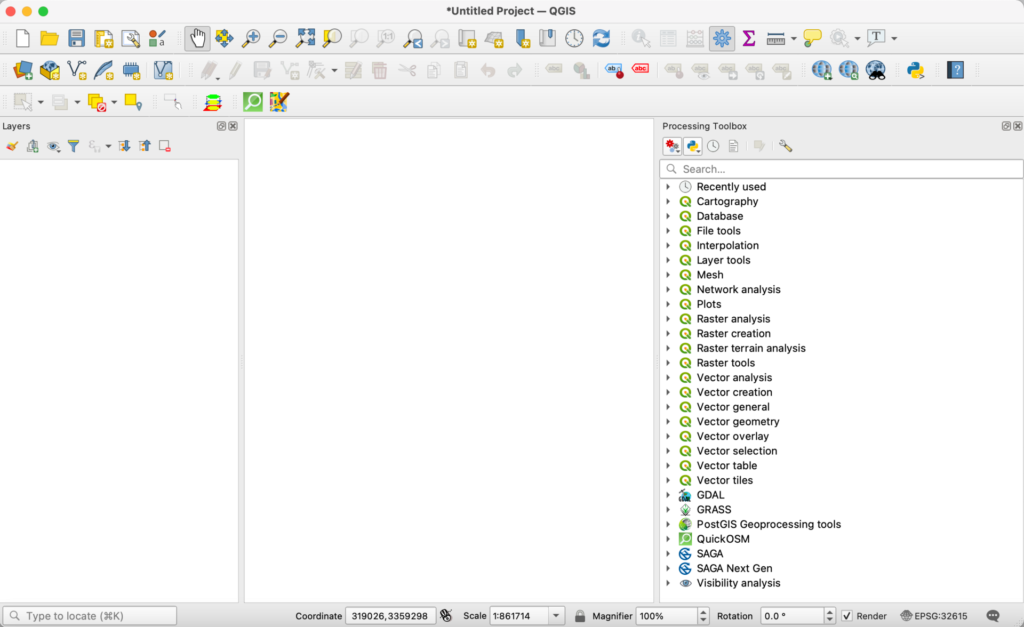
QGIS software interface showing the Processing Toolbox and geographic analysis environment
QGIS provides an integrated environment for geographic information management and spatial analysis, with plugins extending the range of questions researchers can investigate. Image: QGIS Development Team, CC0, via Wikimedia Commons.

Leave a Reply

Your email address will not be published. Required fields are marked *

This site uses Akismet to reduce spam. Learn how your comment data is processed.

Related articles

UDL Thesis Publication 2025

Call for Abstracts now open!

Urban Mapping

MASTERCLASS

Urban Mapping, Analysis and Representation

Session Dates

21st- 22nd November 2026

Curating the best graduate thesis projects globally!

Publish your work and get recognized globally!

Free E-Book

From thesis to Portfolio

A Guide to Convert Academic Work into a Professional Portfolio”

Urban Design Lab

Be the part of our Network

  • Stay updated on workshops, design tools, and calls for collaboration

  • Thesis Report Writing for Architecture and Urban Studies

    Join Our WhatsApp Group

    Recent Posts

    Sign up for our Newsletter

    “Let’s explore the new avenues of Urban environment together “

    E-Book- From Thesis To Portfolio

    A Guide to Convert Academic Work into a Professional Portfolio