Photoshop vs Illustrator: Which Is Better for Urban Mapping?

Urban mapping comparison of Photoshop raster and Illustrator vector map editing

Urban mapping occupies a distinctive position between geographic analysis and visual communication. An urban map must represent spatial relationships accurately while presenting information through a coherent system of colours, symbols, line weights, typography and visual hierarchy. For architects, urban designers and planners, the challenge is not simply to produce an attractive image, but to communicate geographic evidence without compromising its meaning.

Two Adobe applications frequently used for this purpose are Adobe Photoshop and Adobe Illustrator. Both can transform Geographic Information System (GIS) outputs into professionally presented maps, yet they operate through fundamentally different approaches to digital graphics.

Photoshop is primarily designed for raster-image editing, compositing and pixel-based manipulation. Illustrator specialises in vector graphics, where paths, shapes, strokes and fills can be modified independently of output resolution. These distinctions influence how each application handles building footprints, road networks, satellite imagery, land-use classifications, annotations and publication layouts.

The choice becomes particularly important when maps move between software environments. A neighbourhood plan generated in QGIS may contain thousands of building polygons, street centre lines and labelled geographic features. Exporting that information as a raster image and editing it in Photoshop creates a different production workflow from transferring vector geometry into Illustrator.

Neither method is inherently superior in every situation.

A Photoshop-based workflow may be particularly effective for atmospheric terrain maps, landscape representations and satellite-image compositions. Illustrator may be better suited to figure-ground studies, street-network diagrams, land-use graphics and maps requiring precise typography.

However, neither application automatically validates geographic information. Attractive visual design cannot compensate for inaccurate spatial data, inappropriate classification methods or misleading cartographic choices.

The QGIS documentation on print-layout exports confirms that GIS layouts can be exported to raster images, PDF and SVG, with different settings affecting rendering, editability and the preservation of vector elements. These options create several possible workflows, each involving trade-offs.

This article compares Photoshop and Illustrator specifically through the requirements of urban mapping. It examines their underlying graphic structures, analytical applications, export behaviour, advantages, limitations and suitability for different mapping tasks.

The central argument is that professional urban mapping is most effective when GIS remains the analytical foundation, Illustrator handles vector-based cartographic refinement, and Photoshop supports raster imagery and visual compositing where needed.


Understanding the Fundamental Difference: Raster vs Vector Graphics

The distinction between raster and vector graphics is the most important technical consideration when choosing between Photoshop and Illustrator.

According to Adobe’s official explanation of raster and vector files, raster images consist of pixels, whereas vector graphics are defined through geometric shapes, paths and curves.

This difference determines how an image behaves when enlarged, edited or exported.

Raster graphics and Photoshop

Raster graphics represent an image through a grid of pixels. Each pixel stores colour information, and the complete image emerges from the arrangement of these values.

Satellite photographs, aerial imagery, digital elevation visualisations and scanned historical maps are typical examples of raster-based material.

Photoshop is designed to manipulate this kind of information.

Its adjustment layers, masking functions, filters and blending modes allow detailed modifications to photographic and continuous-tone imagery.

For example, an urban designer preparing a terrain map may need to combine a hillshade raster with a coloured elevation surface. Photoshop allows the designer to adjust transparency, contrast and colour relationships between these layers.

However, raster graphics have a fixed number of pixels.

When enlarged beyond the resolution of the original image, the software must interpolate additional pixels. This can reduce apparent sharpness, particularly along thin lines, labels and geometric boundaries.

The effect matters considerably in urban mapping.

A rasterised building-footprint map may appear sharp when viewed at its original size but become visibly blurred when enlarged for an architectural exhibition panel.

Raster quality therefore depends on the original pixel dimensions and the size at which the image will be displayed or printed.

Adobe’s printed image-resolution guidance explains the relationship between pixel dimensions, image resolution and physical print size. It also distinguishes changing the resolution setting from resampling, which changes the actual number of pixels.

Vector graphics and Illustrator

Vector graphics represent geometric elements through mathematical descriptions rather than fixed pixel grids.

A street centre line can be represented as a path, a building footprint as a closed polygon and a public-space boundary as an editable shape.

Adobe’s Illustrator documentation on paths and shapes describes how these elements are constructed from anchor points, line segments, fills and strokes.

The practical advantage is scalability.

A vector road network can be enlarged or reduced without introducing the pixelation associated with a low-resolution raster image.

Its individual paths may also be selected, recoloured, restyled or reorganised when the imported artwork preserves those elements.

This makes Illustrator particularly suitable for maps containing large quantities of geometric linework.

For example, a figure-ground map of an urban precinct may include several thousand building footprints. If the polygons remain editable vectors, their fills and strokes can be modified without redrawing the entire map.

However, Illustrator’s vector environment has its own limitations.

A detailed geographic export can contain extremely large numbers of vertices, nested groups and clipping paths. Complex artwork may become difficult to edit or slow to render.

Vector graphics are therefore not automatically lightweight or easy to manage.

Why the distinction matters

The central difference is not that Photoshop produces attractive maps while Illustrator produces accurate maps.

Both can produce visually sophisticated results, and both can also produce misleading graphics.

Furthermore, Photoshop can contain vector shape layers and editable text, while Illustrator can import and manipulate raster imagery. Adobe documents these overlapping capabilities in its Photoshop shapes and paths guidance.

The distinction concerns their primary editing environments.

Photoshop is most suitable when the map’s visual information is dominated by pixels, continuous tonal variation and layered imagery.

Illustrator is usually more efficient when the map depends on editable paths, geometric precision, line-based symbols and carefully controlled typography.

For urban designers, understanding the representation of each map layer is therefore more useful than simply selecting the application they know best.

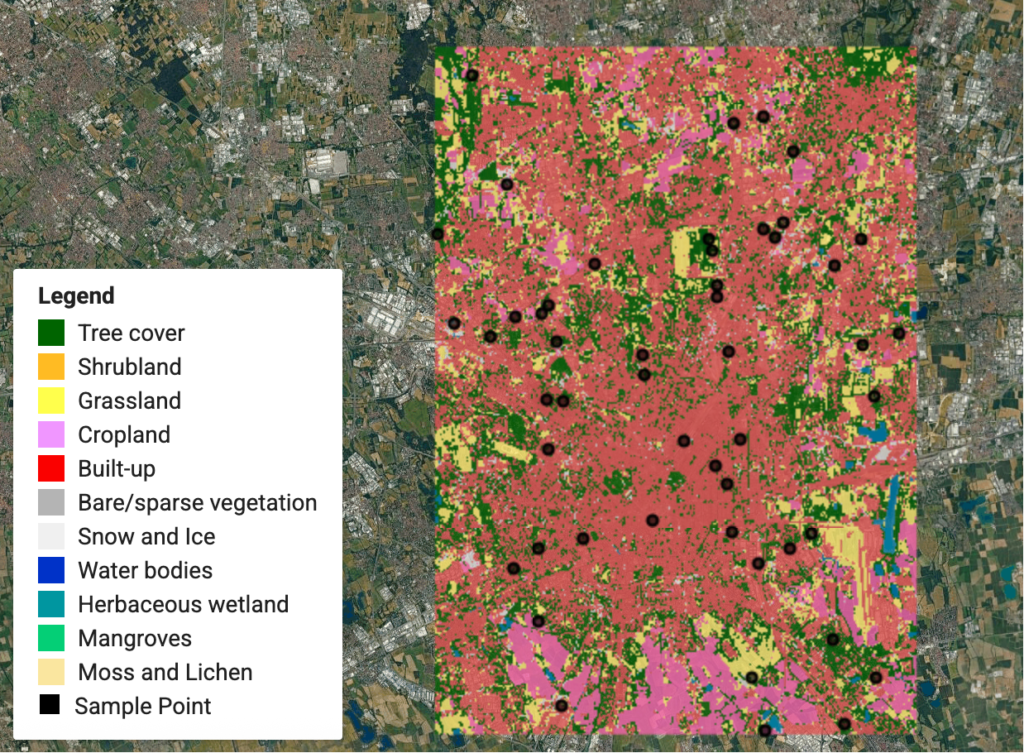
Satellite-based land-cover classification map combining imagery, thematic categories and sampling points
Urban mapping often combines raster imagery with categorical geographic information, requiring different approaches to image editing and vector refinement. Image: Qiongjx, CC BY-SA 4.0, via Wikimedia Commons.

When Photoshop Is Better for Urban Mapping

Photoshop is particularly effective when urban maps depend on satellite imagery, terrain representation, photographic context or multiple layers requiring tonal integration.

Its greatest advantage lies in the ability to manipulate complex visual information without requiring every element to be converted into editable vector geometry.

Satellite imagery and aerial-photo mapping

Satellite and aerial photographs are widely used to understand settlement patterns, urban expansion, vegetation distribution, infrastructure corridors and the relationship between built-up and undeveloped areas.

Such imagery often requires visual adjustments before being incorporated into presentation material.

Photoshop allows the user to modify brightness, contrast, saturation and tonal balance through adjustment layers.

The official Adobe documentation on adjustment layers explains how these operations can be applied non-destructively, preserving the underlying image data within the editing document.

For urban mapping, these capabilities are useful when an aerial photograph needs to function as a subdued background beneath an analytical overlay.

For example, an urban designer examining public-space distribution could desaturate the imagery so that selected parks and pedestrian connections become more prominent.

The image remains useful for identifying surrounding buildings and infrastructure while allowing the thematic information to dominate.

However, image enhancement must not be confused with analytical interpretation.

Aerial-image adjustments may improve readability, but they do not establish land-use categories or identify geographic change without an appropriate classification or verification process.

Terrain visualisation and hillshade compositions

Topography is another application where Photoshop can be particularly effective.

Elevation data can be processed in GIS to generate hillshade, slope or colour-relief rasters.

These outputs may then be combined to create a visual representation of terrain.

A hillshade image encodes modelled illumination across an elevation surface, while a colour-relief map uses colour to represent elevation or another terrain-related variable.

Photoshop can adjust the visual relationship between these outputs using opacity, masks and blending modes.

This is especially useful for urban studies involving hill settlements, river valleys, coastal landscapes and terrain-constrained development.

A study of settlement growth around a hill system, for example, may benefit from a subtle terrain background showing the relationship between development and surrounding landforms.

Photoshop allows continuous control over the visual prominence of terrain shading.

An important distinction is that changing the brightness of a hillshade does not change the elevation values from which it was created. The modified graphic remains a visual interpretation of the analytical raster.

Atmospheric maps and landscape representation

Photoshop is also effective for presentation maps where the objective includes communicating spatial character.

Architectural and landscape presentation boards frequently combine aerial imagery, vegetation textures, shadows, contextual photographs and illustrations.

These elements may be difficult to reproduce efficiently through vector graphics alone.

For example, a proposed waterfront public-space plan may incorporate a verified base map with textured paving, soft vegetation and representative material imagery.

Photoshop can combine these elements into a coherent visual composition.

The resulting drawing may be effective for communicating the spatial atmosphere of a proposed intervention.

Nevertheless, it should distinguish between existing conditions, proposed design elements and illustrative textures.

A rendered row of trees should not be presented as an existing canopy survey unless those trees have been independently documented.

Limitations of Photoshop

Photoshop becomes less efficient when an urban map contains large amounts of linework requiring repeated geometric edits.

Building polygons, street networks and parcel boundaries may be difficult to modify individually once they have been rasterised.

Text also requires attention. Although Photoshop supports editable text layers, labels included within a flattened GIS export cannot be independently edited as text without reconstructing them.

High-resolution raster files may also consume substantial memory, particularly when multiple large image layers are maintained.

For studies requiring repeated revisions to roads, boundaries or thematic categories, Illustrator or the original GIS environment generally offers more controlled editing.

Photoshop is therefore most effective when the map is visually dominated by imagery, terrain or compositing rather than individually editable geographic geometry.

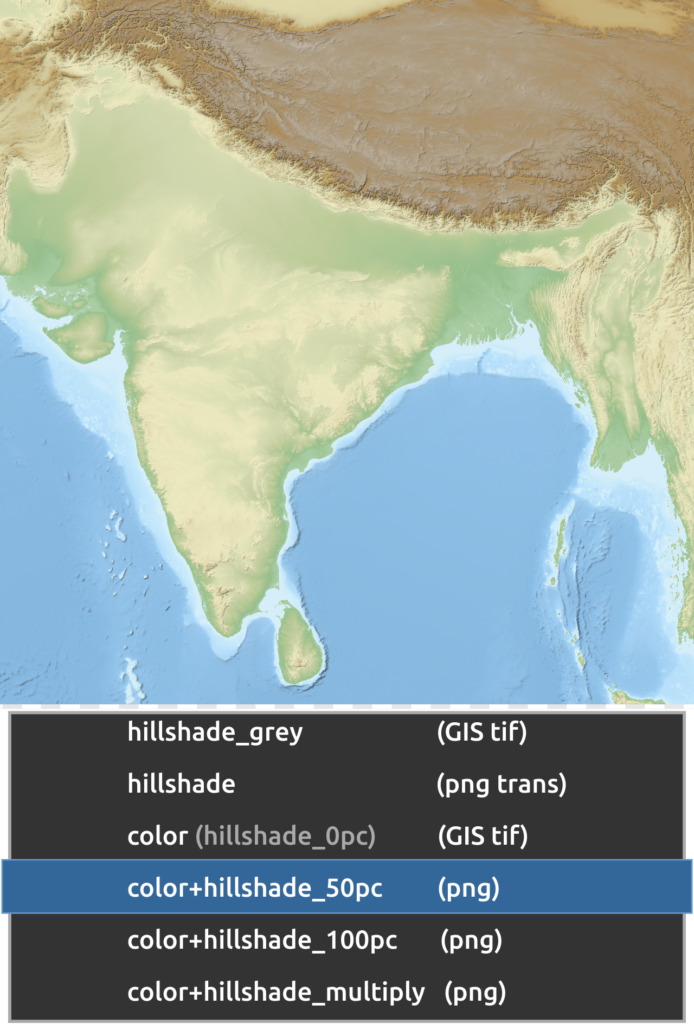
Relief map of India and its surrounding region, showing colour terrain and a partially transparent hillshade composition
Layered colour relief and hillshade demonstrate the value of raster-based compositing for communicating topography and landscape relationships. Image: Yug, CC BY-SA 3.0, via Wikimedia Commons.

When Illustrator Is Better for Urban Mapping

Illustrator is particularly useful for maps based on buildings, streets, plot divisions, movement networks, land-use boundaries and other geometric information.

These elements are generally more effectively managed as editable vector objects.

Figure-ground and urban morphology maps

Figure-ground drawings are widely used in urban design to investigate relationships between built form and open space.

A typical figure-ground map may represent buildings as filled polygons against a contrasting background.

The apparent simplicity of the drawing can conceal substantial geometric complexity.

A large study area may contain numerous individual building footprints, irregular block configurations, courtyards and interconnected open spaces.

When these features are exported as vector shapes, Illustrator allows their visual properties to be refined without changing their overall graphic resolution.

The designer can modify building fills, remove unnecessary outlines, create a consistent colour hierarchy and add annotations.

For example, a historic-precinct study may distinguish between selected heritage structures, other buildings and important public spaces.

Illustrator can help produce a controlled visual hierarchy while maintaining the geometry of the imported features.

However, changes to the location or shape of buildings should be made in the source GIS or measured drawing wherever geographic accuracy is required.

Street-network and mobility diagrams

Street networks are another strong application for Illustrator.

Urban mobility maps often require differentiated line weights, colours, route symbols and labels.

A network may include primary streets, secondary routes, pedestrian connections, transit corridors and selected intersections.

Each type requires a consistent graphic language.

Illustrator’s vector editing environment supports repeated styling of paths and symbols.

A transport-network map, for example, can use different line weights to establish the hierarchy between metropolitan corridors and neighbourhood connections.

The same principles can be applied to pedestrian networks, cycle routes, public-transport diagrams and urban connectivity studies.

Schematic diagrams require an additional distinction.

A schematic transit map may deliberately simplify geographical distances and alignments to improve route interpretation. This can be appropriate for passenger information, provided the diagram is not misrepresented as a geographically precise route map.

In an analytical urban-network figure, the source geometry and modelling relationships should remain intact unless a transformation is explicitly justified.

Land-use diagrams and categorical mapping

Illustrator is well suited to categorical maps in which each spatial unit belongs to a defined class.

Examples include land-use zoning, building typologies, development phases, conservation categories and selected infrastructure systems.

The designer can use vector fills and strokes to establish a coherent palette.

However, the classification itself should originate from the GIS dataset rather than being reconstructed through visual judgement.

The UK Office for National Statistics guidance on choropleth maps recommends choosing colour schemes appropriate to the data and using standardised rates rather than raw counts when preparing area-based statistical maps.

This distinction matters because vector-editing software can make individual regions easy to recolour without retaining the statistical rules that originally assigned their categories.

If a ward is assigned to a density class, its colour must remain consistent with the corresponding class interval.

Illustrator should refine the presentation of those classes, not quietly redefine them.

Typography and publication layout

Map typography is another area where Illustrator offers substantial advantages.

Urban maps often contain multiple levels of text, including street names, neighbourhood labels, analytical annotations, legends, titles, scale information and sources.

These require differentiated type sizes, weights, spacing and alignment.

Illustrator provides precise control over graphic text and its relationship with other objects.

For example, a publication figure may use a strong title, restrained neighbourhood labels and a compact legend.

A consistent typographic hierarchy helps the reader distinguish geographic context from analytical information.

Illustrator is also convenient for preparing multiple related maps within one document.

Artboards can support variations in aspect ratio or separate publication figures, while vector objects can be reused across different compositions.

For a larger report containing extensive text and multiple pages, a dedicated publication-layout application such as InDesign may still be more suitable.

Limitations of Illustrator

Illustrator becomes less efficient when the graphic depends heavily on complex raster imagery.

Large satellite photographs, high-resolution terrain rasters and multiple textures can increase document size and complicate editing.

Although Illustrator can place raster images, it does not provide the same depth of pixel-based editing available in Photoshop.

Extremely detailed geographic vector exports can also create performance issues.

Urban footprints may contain thousands of paths, and the resulting document can become difficult to navigate if the source layers are not organised before export.

For this reason, Illustrator is best regarded as a vector-based cartographic refinement application rather than a substitute for GIS data management.

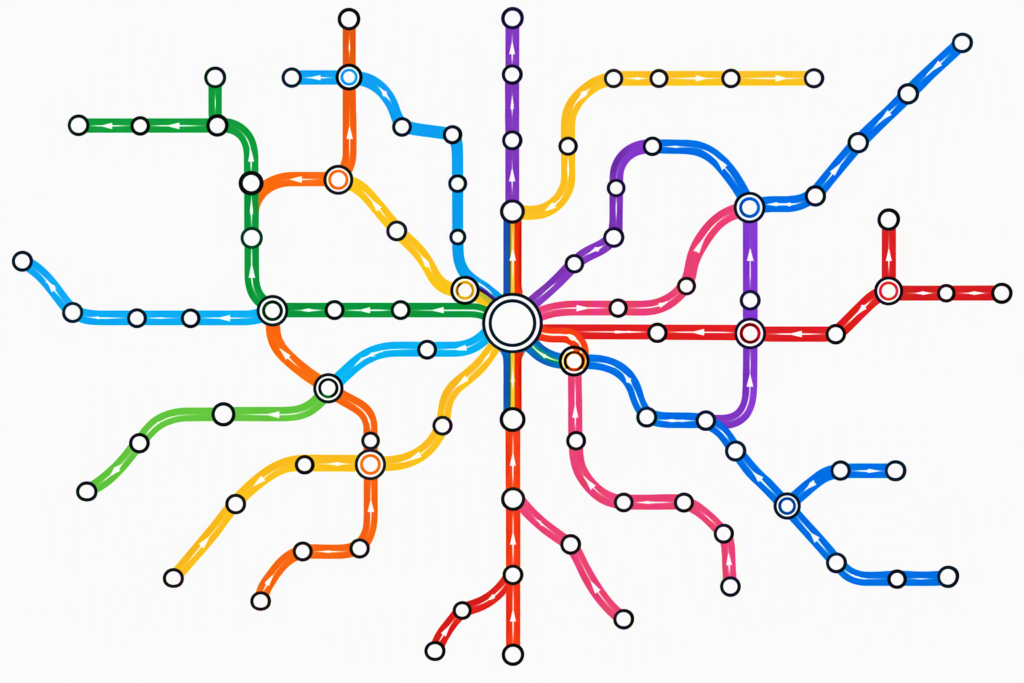
Schematic transit-network graphic showing coloured routes, transfer nodes and repeated station symbols
Transit-network graphics depend on consistent paths, symbols and typography, making vector-oriented editing particularly appropriate for their production. Image: Nwongh, CC BY 4.0, via Wikimedia Commons.

From QGIS to Photoshop or Illustrator: Choosing the Right Export Workflow

For research-oriented urban mapping, the most reliable production process generally begins in GIS rather than directly inside either Adobe application.

QGIS provides the geographic environment in which spatial data can be imported, cleaned, analysed, classified and rendered.

The official QGIS Print Layout documentation confirms that users can assemble geographic maps, legends, scale bars, annotations and other page elements before exporting the results.

The appropriate export method depends on whether the next stage requires raster compositing or vector refinement.

Workflow A: QGIS to Photoshop

This workflow is suitable when the urban map contains imagery or continuous raster surfaces requiring significant visual adjustment.

A defensible sequence is:

  1. Prepare the geographic data and complete the analytical operations in QGIS.
  2. Confirm the coordinate reference system, map extent and classification rules.
  3. Organise the map’s thematic and contextual layers.
  4. Export an image at the dimensions and resolution required for the final publication.
  5. Place the export into Photoshop, preferably as a Smart Object.
  6. Add independent raster imagery, textures or visual treatments through clearly named layers.
  7. Apply masks and adjustment layers without destroying the original map.
  8. Export the final image and inspect it at its intended display size.

Adobe explains in its Smart Object documentation that placed Illustrator and PDF files can be maintained as embedded or linked Smart Objects.

This allows selected content to remain available for non-destructive transformations.

However, Smart Objects do not restore geographic attributes, coordinate systems or analytical relationships.

The source GIS project must remain available for corrections to the actual geographic information.

A researcher preparing an urban thermal-environment illustration might use GIS to prepare land-cover and terrain layers and Photoshop to balance their visual appearance.

The final result could incorporate aerial imagery, selected vegetation areas and supporting annotation.

Such treatment may improve communication, but it should not alter the interpretation of the analytical classes.

Workflow B: QGIS to Illustrator

The QGIS-to-Illustrator workflow is more appropriate when the map relies primarily on geometric vector layers.

A defensible sequence is:

  1. Complete spatial analysis and data preparation in QGIS.
  2. Style geographic layers according to their analytical meaning.
  3. Prepare a QGIS Print Layout at the intended final map dimensions.
  4. Export the layout to an appropriate vector-capable format such as SVG or PDF.
  5. Open the exported artwork in Illustrator.
  6. Inspect grouping, clipping, labels, line weights and transparency.
  7. Refine typography, symbols and graphic hierarchy.
  8. Export a final publication file and compare it against the QGIS reference.

The QGIS export documentation includes an option to export map layers as SVG groups.

This can help organise the transferred artwork according to its source layers.

The documentation also warns that some rendering effects require rasterisation and that forcing all objects to remain vector may change their appearance.

This is particularly relevant to complex symbology, transparent overlays, patterned fills and raster imagery.

Therefore, a PDF or SVG export should be inspected rather than assumed to reproduce the GIS map perfectly.

The importance of preserving geographic integrity

A critical problem arises when an exported drawing is treated as if it retains all the functionality of the original GIS dataset.

An Illustrator path derived from a road centre line may look identical to the source geometry, but it does not necessarily retain the original road attributes, coordinate reference system or network relationships.

Similarly, editing a polygon in Illustrator does not automatically update the source GIS layer.

This distinction becomes particularly important for measured urban analysis.

Consider a study examining changes in street-network configuration between two periods.

If road geometry is adjusted in Illustrator merely to improve visual alignment, the displayed network may no longer match the data used to calculate the analytical indicators.

The resulting figure could appear more polished while becoming less reproducible.

The appropriate solution is to edit the geographic data in GIS, rerun the relevant analysis if necessary, and then regenerate the publication artwork.

A more reliable hybrid workflow

Many urban maps benefit from using both Photoshop and Illustrator.

For example, a regional landscape map may require a terrain base, an aerial photograph, an urban street network and multiple annotations.

In this case, the workflow could proceed as follows:

QGIS: Prepare and analyse the geographic data, including terrain, roads, settlement boundaries and thematic layers.

Photoshop: Process raster imagery and refine the visual relationship between aerial photography and terrain.

Illustrator: Combine the prepared imagery with vector roads, boundaries, labels, legends and publication graphics.

Adobe’s Photoshop-to-Illustrator interoperability documentation confirms that Photoshop files can be opened, placed, linked or embedded in Illustrator.

However, import methods preserve different aspects of the original Photoshop document. Opening layers as objects does not preserve all Photoshop adjustment layers and effects.

A linked file is often preferable when the raster composition will continue to evolve.

This makes the workflow easier to revise because changes made to the linked Photoshop file can be reflected in Illustrator.

The principal advantage of the hybrid approach is therefore not simply combining two applications. It is preserving the separation between spatial analysis, raster editing and vector-based graphic composition.

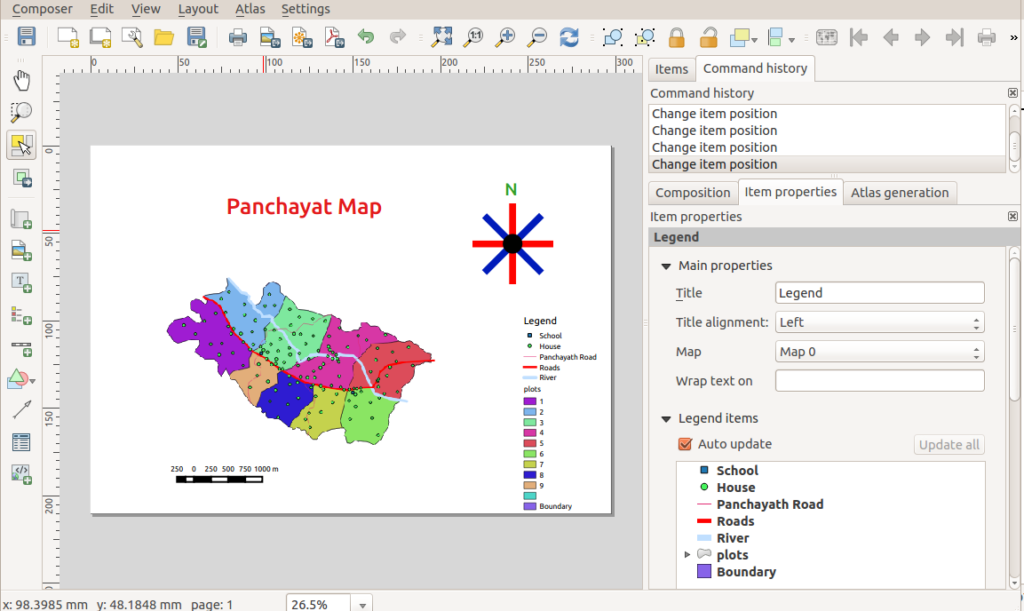
QGIS Print Composer interface displaying a map with polygons, roads, legend, scale bar and north arrow
QGIS provides the geographic and cartographic foundation from which raster and vector outputs can be transferred into Photoshop or Illustrator for further refinement. Image: Path slopu, CC BY-SA 4.0, via Wikimedia Commons.

Which Software Should You Choose for Different Urban Mapping Tasks?

Choosing between Photoshop and Illustrator requires consideration of the map’s analytical purpose, the nature of its visual elements, the expected revisions and the final output format.

A useful decision should begin with the mapping task rather than the preferred software.

Comparing applications by mapping requirements

Urban mapping task Preferred application Principal reason
Figure-ground mapping Illustrator Editable building polygons and clean linework
Street-network diagrams Illustrator Scalable paths, strokes and symbols
Land-use presentation maps Illustrator Consistent vector fills and categories
Satellite-image mapping Photoshop Pixel-level image and tonal adjustments
Hillshade and terrain compositions Photoshop Raster blending and continuous-tone control
Urban morphology diagrams Illustrator Precise geometric representation
Architectural site-analysis boards Both Combination of raster context and vector annotation
Public-space and landscape illustrations Photoshop or both Photographic textures with supporting linework
Transport schematics Illustrator Controlled routes, nodes and labels
Publication maps with extensive typography Illustrator Flexible text and vector composition
High-resolution raster posters Photoshop Image-based compositing at a defined output size
Measured spatial analysis QGIS Geographic attributes and analytical operations

This comparison is a workflow recommendation based on documented software capabilities, not a universal performance ranking.

The strongest choice depends on the content of the map.

A land-use map constructed from satellite imagery may require significant raster processing in GIS and Photoshop before final typography is prepared in Illustrator.

Conversely, a simple figure-ground map may require little or no Photoshop work.

Output resolution and print quality

The final publication medium can also influence the decision.

Vector graphics are advantageous when a map must remain sharp across different output sizes.

A street-network diagram prepared in Illustrator can generally be scaled without the pixelation associated with a flattened raster graphic.

Photoshop maps require sufficient pixel dimensions for their intended reproduction.

Adobe’s print preparation guidance discusses common print workflows and emphasises the importance of obtaining the output requirements from the printing provider.

Although 300 pixels per inch is a common target for high-quality printed raster images, it is not a universal requirement for every map or printing process.

The appropriate resolution depends on the output method, viewing distance, image content and final dimensions.

A large exhibition board viewed from a distance may have different raster-resolution requirements from a small journal figure containing fine annotations.

For print production, vector linework and typography can remain advantageous even when the supporting background image is raster-based.

RGB, CMYK and colour consistency

Colour management presents a separate technical challenge.

Photoshop and Illustrator both support workflows involving RGB and CMYK colour.

However, colour appearance is influenced by the colour profile, display conditions, output device and conversion settings.

Adobe’s colour-profile guidance explains that identical numerical colour values can produce different appearances when interpreted through different colour spaces or devices.

For maps containing quantitative colours, unintended shifts may reduce the distinction between categories.

A sequential colour scheme that is clear on screen may be more difficult to interpret after an inappropriate print conversion.

Therefore, it is advisable to retain source colour specifications, use suitable document profiles and inspect the intended output.

For professional printing, the output profile should be confirmed with the printing service rather than assuming that every document must be converted to a generic CMYK profile at the beginning of the workflow.

File size and editing performance

Another consideration is document complexity.

Photoshop files can become large when they contain multiple high-resolution image layers.

Illustrator files can also become computationally demanding when they contain highly detailed vector networks or large quantities of individual polygons.

Neither application is automatically lighter.

Adobe’s Illustrator Links panel documentation distinguishes between linked assets, which maintain an external source connection, and embedded assets, which become part of the document.

Using linked raster files can make a complex Illustrator project easier to maintain when the underlying imagery requires periodic updates.

However, links must be managed carefully when files move between computers or collaborators.

Similarly, raster-resolution requirements should be established before building a large Photoshop composition.

Common mistakes to avoid

One recurring mistake is rasterising an entire QGIS export too early.

Once building footprints, street networks and labels are flattened into pixels, the ability to revise them independently becomes limited.

Another mistake is transferring complex GIS geometry into Illustrator without checking the resulting grouping and clipping structure.

A document containing thousands of unorganised paths may be difficult to maintain and vulnerable to accidental changes.

A third mistake is introducing analytical modifications during visual finishing.

Changing class colours, removing polygons or moving geographic boundaries may alter the apparent research findings.

Such modifications should be distinguished from legitimate adjustments to typography, line weight or visual hierarchy.

A fourth mistake is prioritising graphic effects over cartographic interpretation.

The Office for National Statistics guidance on colour in data visualisation emphasises the importance of meaningful colour choices, suitable contrast and distinguishable categories.

A visually elaborate map can be less effective than a simple one if its colours obscure the data.

Finally, designers sometimes use Adobe applications for tasks better completed within GIS.

QGIS itself supports map layout, scale bars, legends, labels and export to multiple formats. A map does not automatically require Photoshop or Illustrator to be professionally publishable.

The appropriate workflow is the one that produces a clear and defensible result with the fewest unnecessary transformations.

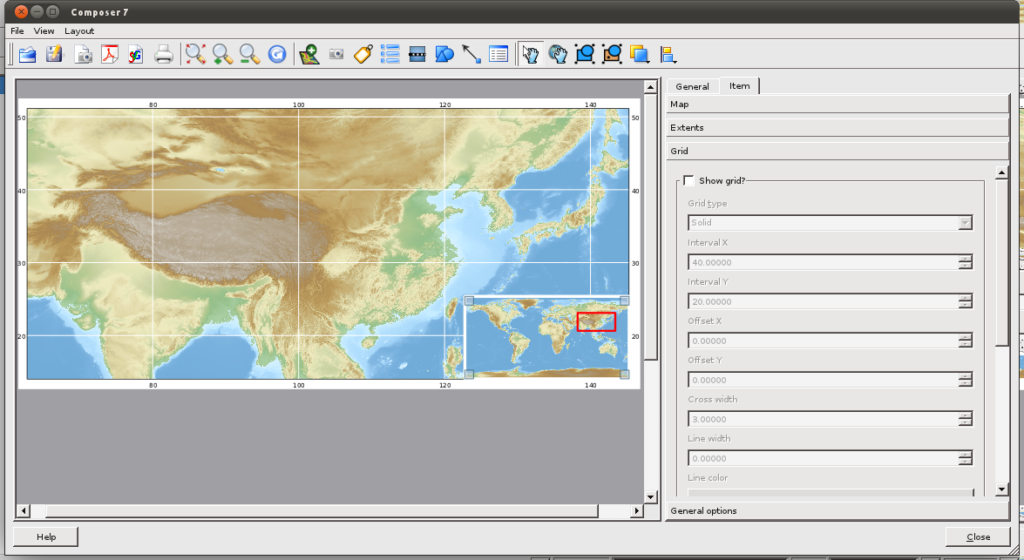
High-resolution regional relief map of Asia, showing terrain colours, geographic context and a locator inset
A high-resolution raster map can communicate detailed terrain and geographic context effectively when its resolution and output dimensions are appropriate. Image: Yug, CC BY-SA 3.0, via Wikimedia Commons.

Conclusion

The choice between Photoshop and Illustrator for urban mapping is best understood as a question of representation and workflow rather than overall software superiority.

Illustrator is generally the stronger choice for maps that depend on editable vector geometry. Figure-ground diagrams, building-footprint maps, street networks, transport schematics and typographically detailed publication figures benefit from its control over paths, strokes, fills and scalable graphic elements.

Photoshop is generally more effective for raster-based mapping and visual compositing. Satellite imagery, hillshade, terrain representation, aerial-photo analysis and landscape-oriented illustrations benefit from its image-processing and layering capabilities.

However, the distinction is not absolute.

Both applications contain overlapping tools, and many sophisticated urban maps require a combination of raster and vector information.

For research-oriented mapping, the most defensible workflow is to preserve geographic data and analytical operations in GIS before transferring selected outputs into Adobe applications.

Illustrator and Photoshop should improve the clarity, consistency and visual communication of spatial evidence rather than become unrecorded environments for altering analytical results.

The decisive criterion is therefore not which application produces the most visually striking map, but which workflow preserves the relationship between geographic accuracy, cartographic hierarchy, analytical transparency and effective communication.

A well-designed map should allow readers to understand what is being represented, identify the relevant spatial relationships and distinguish measured conditions from interpretation or proposed intervention.

Ultimately, the strongest urban mapping workflow combines the analytical capabilities of GIS with the specific graphic strengths of Photoshop and Illustrator, using each application where it contributes the greatest value.

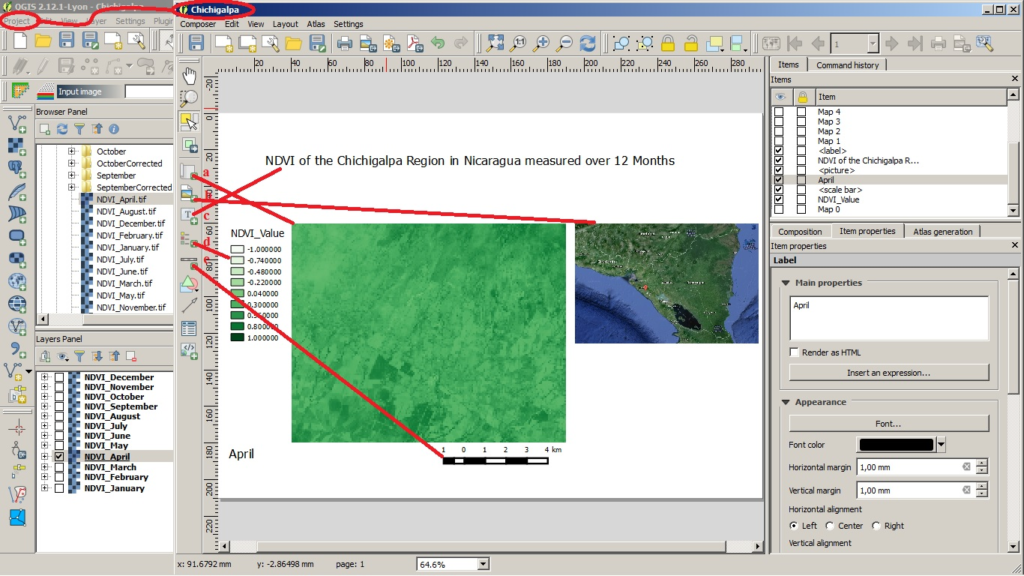
QGIS Print Composer displaying a land-cover and vegetation-index map with a legend, geographic reference image and scale bar
A reliable urban mapping workflow preserves analytical information in GIS while using graphic-design software selectively to improve the readability and consistency of the final map. Image: Felix Kullmann, CC BY-SA 4.0, via Wikimedia Commons.

Leave a Reply

Your email address will not be published. Required fields are marked *

This site uses Akismet to reduce spam. Learn how your comment data is processed.

Related articles

UDL Thesis Publication 2025

Call for Abstracts now open!

Urban Mapping

MASTERCLASS

Urban Mapping, Analysis and Representation

Session Dates

21st- 22nd November 2026

Curating the best graduate thesis projects globally!

Publish your work and get recognized globally!

Free E-Book

From thesis to Portfolio

A Guide to Convert Academic Work into a Professional Portfolio”

Urban Design Lab

Be the part of our Network

  • Stay updated on workshops, design tools, and calls for collaboration

  • Thesis Report Writing for Architecture and Urban Studies

    Join Our WhatsApp Group

    Recent Posts

    Sign up for our Newsletter

    “Let’s explore the new avenues of Urban environment together “

    E-Book- From Thesis To Portfolio

    A Guide to Convert Academic Work into a Professional Portfolio