Why Your QGIS Map Looks Different After Exporting to Illustrator

QGIS export opened in Illustrator showing differences in colour and line weights

A map can look precisely balanced in QGIS, then appear misaligned, pale, unexpectedly bold or partially rasterised when opened in Adobe Illustrator. Fonts change, faint lines become heavier, relief disappears behind masks, and layers that were carefully organised in a geographic information system arrive as an inconvenient collection of clipped shapes. These changes are often blamed on a bad export. In reality, several distinct processes may be involved: QGIS is rendering geographic data, the exchange format is storing selected aspects of that rendering, and Illustrator is interpreting those instructions as graphic artwork.

This distinction matters for urban design and planning. A map may be a technical exhibit in which legibility, spatial relationships and analytical fidelity are essential, or it may form part of a publication plate where typography, colour and composition need further refinement. The transfer between applications should improve communication without silently changing what the spatial evidence says. QGIS documents separate image, SVG and PDF output pathways and provides settings for resolution, vector export, raster rendering and SVG grouping (QGIS export documentation). None of those output choices guarantees that every GIS appearance or spatial behaviour will remain editable in the same form in Illustrator.

The central argument of this article is that a QGIS-to-Illustrator workflow should be treated as a controlled translation, not as the movement of a single unchanged map. The most reliable method begins by identifying the map elements that must remain faithful to the source, selecting the exchange format accordingly, and inspecting the result through a documented quality-control procedure. The following sections explain the different failure mechanisms, the consequences for urban research and a more defensible production workflow.

Two different rendering systems are interpreting the same design

In QGIS, a map is produced by combining geographic layers, coordinate reference systems, symbol settings, labels and layout items. A building polygon has a geographic identity and attributes; a labelled street may depend on scale, collisions with other labels, priority rules and font metrics. The print layout then positions map frames, legends, text, north arrows, images and scale bars on a page. QGIS describes its print layout as a system for assembling and exporting precisely these kinds of elements (QGIS print layout documentation). The apparent simplicity of the final map conceals a chain of operations.

Illustrator works with graphic objects, groups, paths, text and embedded or linked imagery. An imported PDF or SVG can retain a useful share of the QGIS appearance, but it does not automatically preserve the relationships that generated that appearance. A road that was a GIS line with a data attribute can become one or more Illustrator paths. A map label that was calculated from a geographic feature can become positioned text or an outlined shape. A symbol that had a QGIS rendering effect may become a bitmap or an expanded vector object. The distinction is one of representations rather than software quality: the map is being converted from a data-driven document into graphic instructions.

This conversion means that appearance and editability are independent variables. A PDF may match the QGIS preview closely while being difficult to revise; an SVG may offer editable paths but need corrections to masking, transparency or text. The more demanding the symbology, the less defensible it becomes to assume an entirely lossless translation. QGIS itself cautions that some effects require rasterisation even when vector output is requested (QGIS export documentation). That warning should guide production choices instead of being treated as evidence of a broken file.

A useful first diagnostic is to compare three outputs: the original layout within QGIS, a high-resolution PNG exported directly from QGIS, and the PDF or SVG opened in Illustrator. If the PNG and QGIS agree but Illustrator differs, concentrate on import and vector interpretation. If both the PNG and the vector version are inconsistent with the QGIS page preview, investigate layout export settings, missing assets and the underlying QGIS symbol construction. This is a practical diagnostic inference, not a guaranteed identification of a single cause. Several problems can occur together.

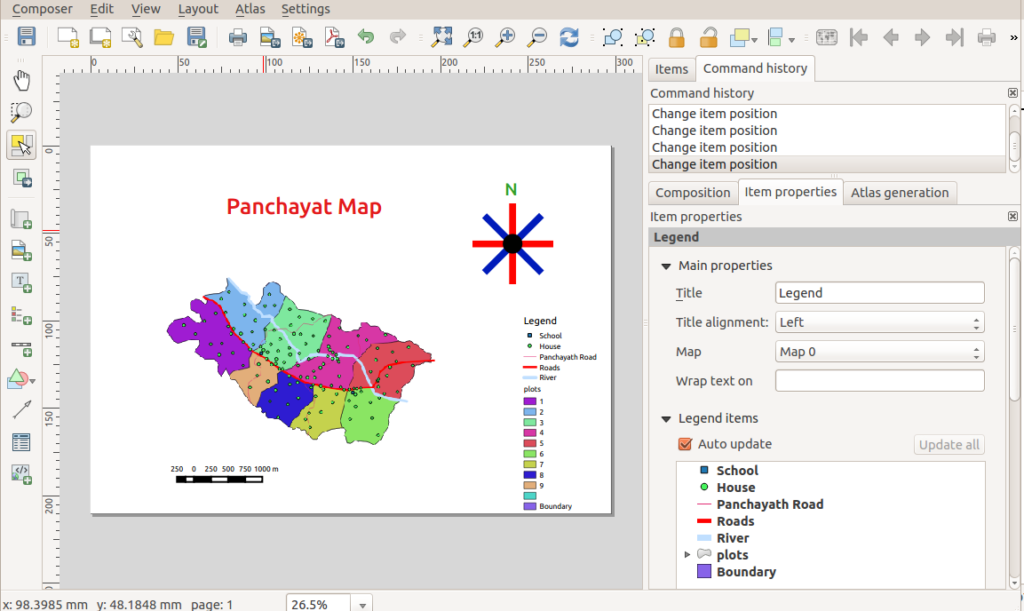
QGIS print composer with map items, labels and visual settings
The live GIS layout contains behaviours that may not survive as editable Illustrator objects. Image: Path slopu, CC BY-SA 4.0, via Wikimedia Commons.

PDF and SVG carry different compromises for urban maps

QGIS officially provides PDF, SVG and raster-image layout export routes (QGIS export documentation). The choice should depend on what will happen after export. PDF is typically useful for retaining a defined page composition with typography and mixed raster-vector content. SVG can be attractive when paths and groups must be edited in a vector application. PNG and TIFF provide a useful rendering baseline, but their pixel content is not independently editable as GIS polygons or vector lines. No one format is best across all scales and design tasks.

The export settings matter as much as the file extension. QGIS includes an option to export map layers as SVG groups, allowing components to be separated in some workflows (QGIS export documentation). That can make it easier to adjust a network, built-form layer or annotation layer in Illustrator. Grouping, however, should not be mistaken for preservation of GIS database structure. Map layers may arrive divided into many drawing elements and the original attribute table, spatial indexes or project styling logic are not recreated as an Illustrator editing environment.

PDF offers its own configuration choices. The official QGIS guidance describes geometry simplification, text rendering and rasterisation-related options whose settings may influence the balance between visual fidelity and file complexity (QGIS export documentation). A highly detailed building-footprint map can generate an exceptionally complex vector artwork file. Simplifying linework may improve editability and output size, but it can also change small geometries that matter at a large plotted scale. For a metropolitan context sheet, that trade-off may be negligible; for a measured urban block study, small changes around courtyards, narrow passages and cadastral corners could be unacceptable. The proper threshold is therefore project-specific, not a generic “simplify everything” rule.

PDF and SVG are also not synonymous with automatic print reliability. Illustrator’s official colour-output documentation distinguishes settings for colour handling and conversion when producing PDF (Adobe PDF colour-output guidance). An apparently successful SVG transfer can still lead to altered print colour if the final layout is converted without checking its destination profile. Conversely, a PDF that looks correct on one screen cannot alone establish that a press-ready CMYK version will reproduce all shades exactly. Separate the GIS exchange decision from the final publication or printer-delivery decision.

A practical division of labour is to keep spatial analysis, data joins, projection management and legend validation in QGIS; use Illustrator for final vector layout refinements that do not compromise the underlying geography; and return to QGIS whenever an actual data-dependent element needs correction. This avoids creating an attractive but analytically orphaned drawing that cannot be reconstructed from the project data.

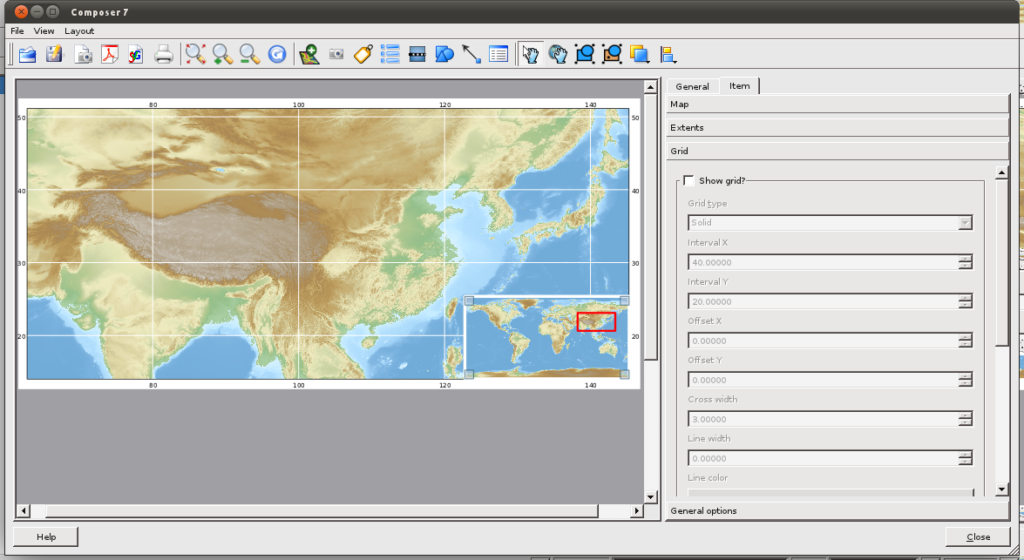
Historic QGIS print composer displaying a shaded regional map
Mixed image, line and annotation content must be checked after export. Image: Yug, CC BY-SA 3.0, via Wikimedia Commons.

Why fonts, lineweights, colours and effects change

Font substitution and the choice to outline text

Different text layouts are among the most visible export surprises. Illustrator can identify missing fonts and provides a workflow for previewing or replacing them (Adobe missing-font guidance). If a font used in a QGIS project is absent from the Illustrator system, replacement may change character widths, line breaks and label spacing. A road name can overlap a boundary even though its placement was correct when calculated in QGIS. The existence of a replacement workflow does not mean that the substituted font is metrically identical.

There are two sensible but different remedies. Preserve text as text when later editing, accessibility or translation is important, and use the same font family and weight on both systems. Convert text to paths where consistent appearance across software takes priority, while recognising that outlined letters are no longer ordinary editable text. For collaborative research graphics, it is often prudent to maintain a text-editable master and a separately labelled outlined delivery copy. This is a workflow recommendation rather than a universal export rule.

Subtle strokes and transparency

Thin streets, water edges and contour lines may look bolder or fainter because stroke alignment, scaling, anti-aliasing and rendering differ between the two applications. QGIS export controls include anti-aliasing and vector/raster-related options (QGIS export documentation). A line drawn at a fraction of a point can be sensitive to screen zoom and raster preview resolution. Inspecting the map at a single arbitrary on-screen magnification is therefore insufficient to determine whether a stroke will reproduce well at its intended final size.

Opacity introduces a related problem. A land-use overlay might have been designed to reveal an underlying street network. When the drawing is converted to separate objects or transparent groups, its interaction with other objects can change if blend modes, clipping groups or rasterisation differ. In a publication map, this can affect apparent thematic emphasis: a moderately shaded flood zone may look more severe or less visible than intended. For that reason, visual differences should be assessed against the original map’s meaning, not merely against aesthetic preference. When uncertainty remains, compare pixel-level renderings at a common size and inspect the resulting composite visually.

Raster relief, patterned fills and clipping

Hillshade, satellite imagery, texture overlays and certain complex symbologies are inherently raster or may be rasterised during export. QGIS warns that forcing vector output can affect the appearance of some visual effects (QGIS export documentation). Illustrator’s clipping-mask tools can then be used to organise imported shapes, but clipping is a graphic operation; it does not rebuild an original GIS mask, spatial query or raster processing pipeline (Adobe clipping-mask documentation). A seemingly missing hillshade may simply be clipped away, placed underneath an opaque fill or interpreted in an unexpected group order.

For a landscape or terrain map, consider whether the analytical hillshade should remain a linked raster with known resolution and geographic coverage while roads and annotations remain vector. This hybrid approach often offers a defensible division between continuous surface imagery and crisp reference geometry. It is an editorial technique, not a claim that every relief map must be assembled in this way. The correct decision depends on output size, required revision and available computing resources.

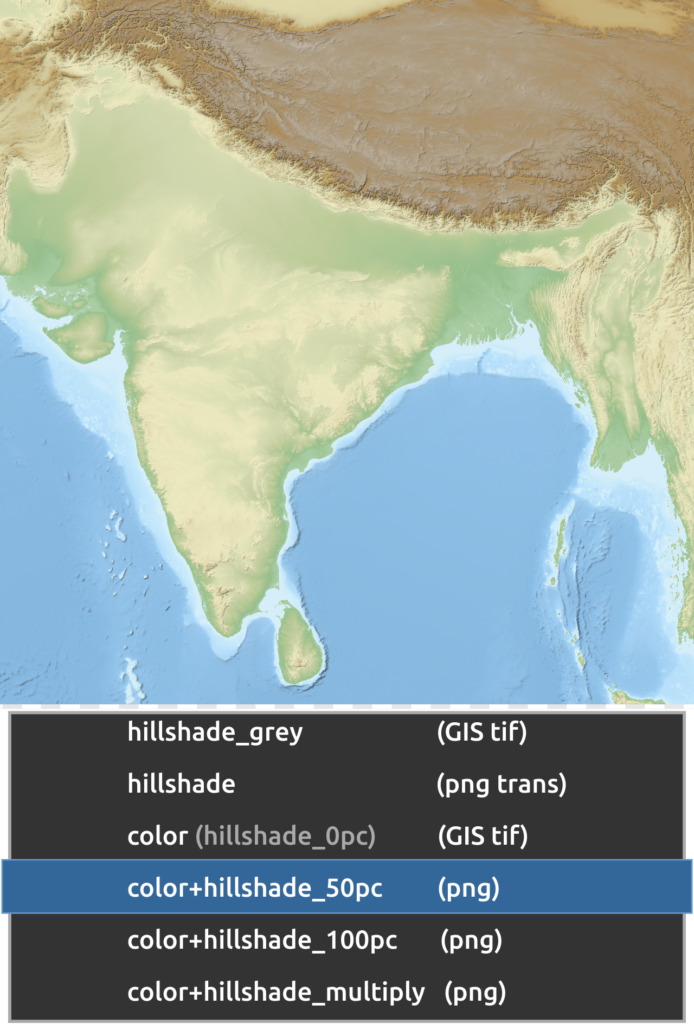
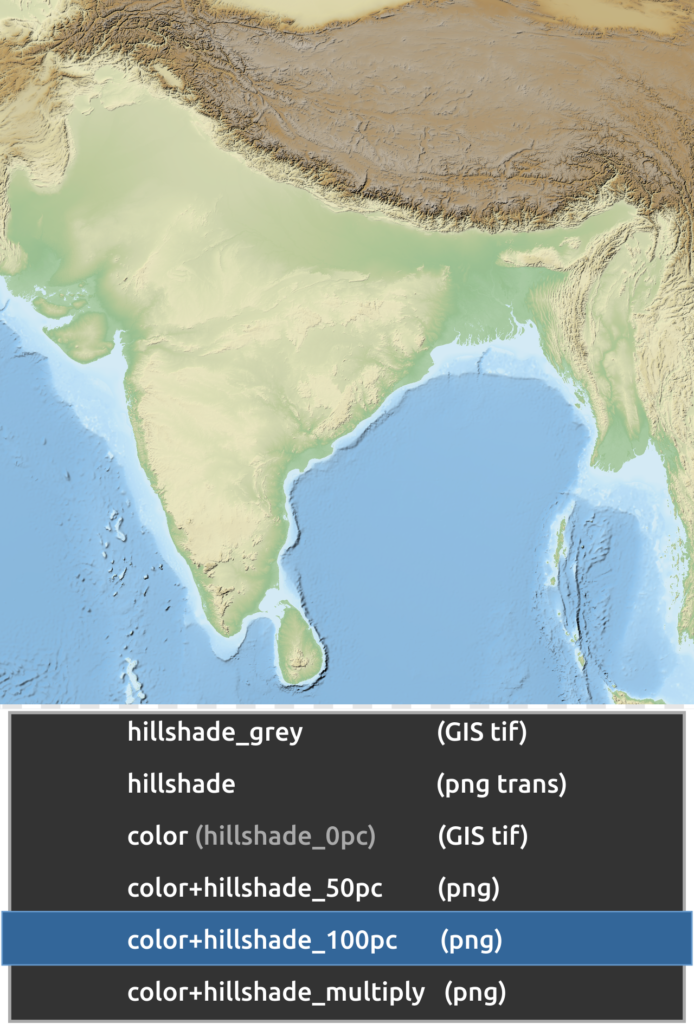
Hillshade relief map showing intermediate terrain shading
Terrain appearance can change with opacity, compositing and rendering interpretation. Image: Yug, CC BY-SA 3.0, via Wikimedia Commons.

Scale, projection and data identity cannot be reconstructed from artwork

The visual fidelity of an exported map should not be confused with geospatial fidelity. Geographic layers in QGIS exist in a coordinate reference system and may be displayed through on-the-fly transformation. Map projections involve trade-offs among geometric properties such as area, distance, direction and shape; the US Geological Survey cautions that different projection choices are appropriate for different mapping purposes (USGS projection guidance). Illustrator does not become a geographic information system merely because the imported SVG or PDF was generated by one.

When a map is resized in Illustrator, the measured geographic extent does not recalculate itself. A carefully laid-out scale bar may be preserved visually but become inconsistent if the map frame alone is scaled, cropped or stretched. The same applies to north arrows and inset relationships: they should be audited after any transformation. A neat page can therefore contain an internally contradictory scale representation even when no visible export error appears. As a quality-control practice, scale the whole composed map consistently or regenerate the scale-sensitive items in QGIS when the map extent or output size changes.

The same logic applies to analytical classifications. Suppose a QGIS choropleth uses population density joined to ward polygons. In Illustrator, a designer can recolour individual shapes, but the original data join, class breaks and indicator definitions may no longer be available. A change intended only to harmonise the colour scheme can accidentally imply a different classification. The UK Office for National Statistics advises careful treatment of choropleth class breaks and comparability when communicating mapped data (ONS choropleth guidance). Therefore, update quantitative thresholds and class membership in the source GIS, then export the checked result.

For urban morphology, this is particularly consequential. Building footprints, street centre lines and public-space polygons are frequently used as inputs to measured analysis. Illustrator’s direct-selection tools may be useful for adjusting labels and non-analytical embellishment, but editing the geometry of a research layer in the final artwork can sever the link between the displayed figure and the dataset described in the methods. A defensible workflow labels the Illustrator file as a presentation derivative and retains the GIS source, data version, CRS, layer styles and final exported baseline.

This separation does not diminish the value of Illustrator. It makes its value more precise. Vector composition is useful when preparing multi-map figures, bilingual annotations, callout leaders, figure numbering and consistent publication typography. It is less suitable for validating coordinate transformations, recalculating buffers or checking statistical joins. Mixing those roles obscures provenance and makes later revisions unnecessarily risky.

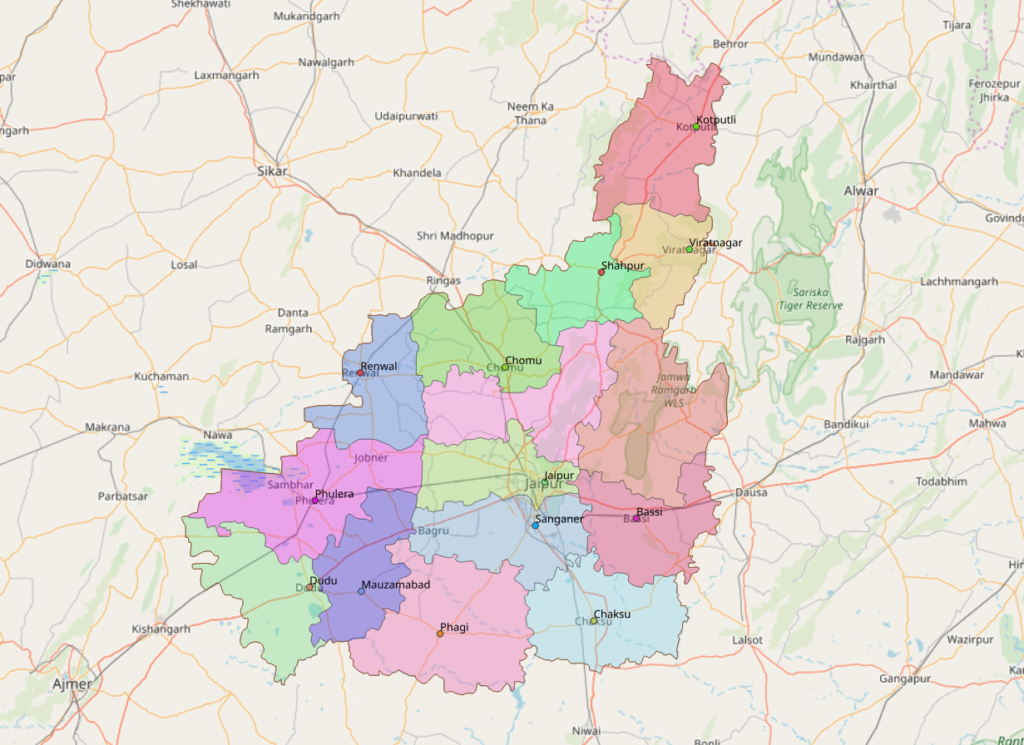
Jaipur regional administrative boundaries and reference features
Preserving apparent boundaries does not mean the artwork retains its geospatial data identity. Image: Heinz OSM, ODbL, via Wikimedia Commons.

A reproducible QGIS-to-Illustrator troubleshooting workflow

A robust export process begins before any file is opened in Illustrator. The following sequence is intended as a practical production protocol, not as a claim that every GIS project or software version uses identical menus. Confirm exact available controls against the QGIS version in use and the official export documentation (QGIS export documentation).

First, freeze the analytical state of the map. Save the QGIS project, record the data sources and their relevant versions, confirm the coordinate reference system, and ensure that class breaks, units, legends and scale bars are correct. Fix labels that collide in the map frame rather than assuming Illustrator will be an efficient place to repair dozens of individual text objects. A baseline that is already ambiguous cannot be made rigorous by subsequent graphic polishing.

Second, create a reference image at the final intended page size and a suitable export resolution. QGIS offers image export with adjustable resolution and anti-aliasing settings (QGIS export documentation). This reference image establishes what the QGIS renderer produced at that point in the workflow. Keep it unchanged. It is more useful for troubleshooting than a screenshot taken at arbitrary zoom because a screenshot also reflects display scaling and screen capture conditions.

Third, produce test copies of PDF and SVG from the same saved layout. Where the project uses rich symbology, compare the vector-oriented output setting with a version that permits rasterisation. Evaluate which better retains the evidence-bearing elements. If SVG layer grouping is needed, enable and inspect it; if grouping produces unmanageable artwork, try PDF or separate thematic exports instead. The aim is not to maximise the count of editable paths but to maximise useful editability while preserving meaning.

Fourth, open the candidate files in Illustrator and inspect them systematically. Start with page bounds and missing fonts; next check clipping groups, opacity and lineweight; then review raster placement, annotations and final colour. Adobe’s font-management guidance and clipping-mask documentation provide the relevant Illustrator controls (Adobe missing-font guidance) (Adobe clipping-mask documentation). Compare against the unchanged reference PNG at the intended final output dimensions. If differences are found, record them by category rather than repeatedly changing multiple settings at once. One-variable-at-a-time testing makes a diagnosis more defensible.

Fifth, retain a structured file system. A project folder can separate `source_qgis`, `data`, `qgis_reference_png`, `export_pdf_svg`, `illustrator_master` and `final_output`. Use descriptive versions rather than vague names like `final_final_v7`. When a collaborator asks why the road network looks different in the publication, the team should be able to identify which export was used and whether the difference originated before or after import.

Finally, perform a publication check independent of the working screen. Inspect the map at printed or intended display size, verify that legends still match colours, confirm that the scale representation is valid, and retain attribution for basemap data. If the figure is going into an academic article, check whether the visible geometry supports exactly the claims made in the methods and results. If the figure is going onto a website, assess readability at mobile display sizes and provide explanatory text for complex spatial information. The W3C’s accessibility guidelines offer a broader framework for text and non-text communication, although they are not a GIS-specific export standard (W3C WCAG 2.2).

The workflow has one important limitation: it can reveal and reduce differences, but it cannot guarantee that every QGIS visual effect will be represented identically in every Illustrator version, printer pipeline or screen environment. That is why retaining a stable rendering reference is more reliable than depending on presumed perfect interchangeability.


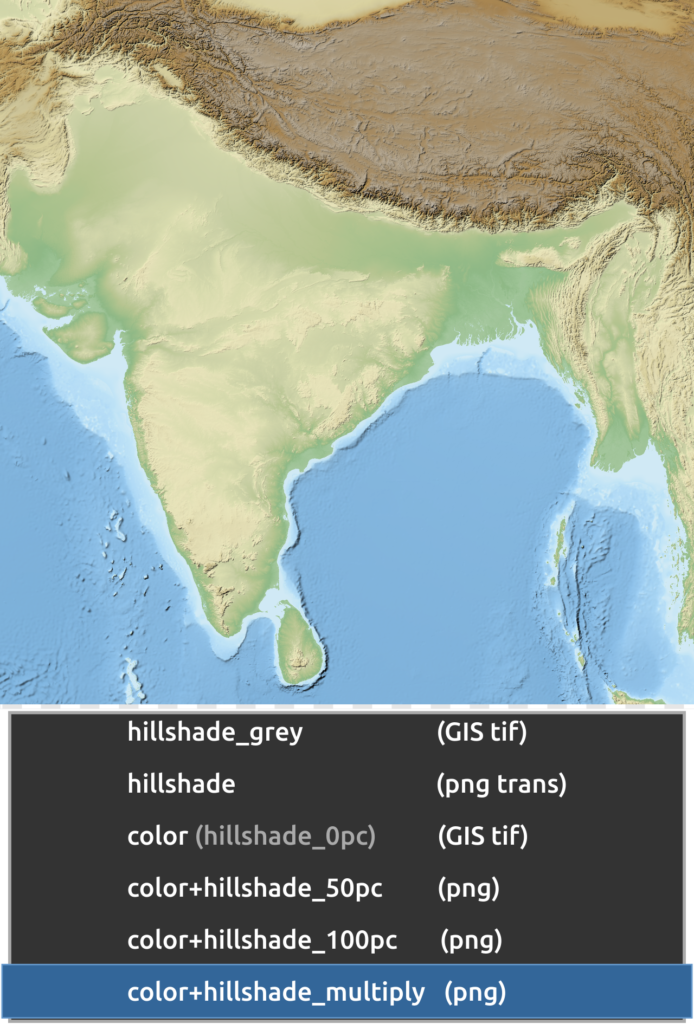
Hillshade terrain treatment produced through blended visual layers
Compare exported raster appearance with the Illustrator import when testing complex effects. Image: Yug, CC BY-SA 3.0, via Wikimedia Commons.

Conclusion

A QGIS map usually looks different in Illustrator because the two applications do not preserve exactly the same combination of geographic meaning, rendering instructions and graphic editability. PDF and SVG offer useful exchange routes, but fonts, opacity, vector effects, clipping and colour settings can alter what arrives. More importantly, an imported artwork file does not necessarily preserve coordinate reference systems, class breaks, feature attributes or scale-dependent relationships (QGIS export documentation) (Adobe missing-font guidance).

The defensible response is not to abandon Illustrator or to force every graphic component into vector form. It is to distinguish the analytical map from its presentation derivative, keep a faithful QGIS baseline, choose export settings according to the needed edits, and test the final figure against both technical and communicative criteria. When that division of responsibility is explicit, Illustrator can improve the clarity of urban maps without becoming an unrecorded source of analytical changes.

Relief map with strong hillshade treatment
A fixed reference rendering helps assess whether post-export edits change cartographic meaning. Image: Yug, CC BY-SA 3.0, via Wikimedia Commons.

Leave a Reply

Your email address will not be published. Required fields are marked *

This site uses Akismet to reduce spam. Learn how your comment data is processed.

Related articles

UDL Thesis Publication 2025

Call for Abstracts now open!

Urban Mapping

MASTERCLASS

Urban Mapping, Analysis and Representation

Session Dates

21st- 22nd November 2026

Curating the best graduate thesis projects globally!

Publish your work and get recognized globally!

Free E-Book

From thesis to Portfolio

A Guide to Convert Academic Work into a Professional Portfolio”

Urban Design Lab

Be the part of our Network

  • Stay updated on workshops, design tools, and calls for collaboration

  • Thesis Report Writing for Architecture and Urban Studies

    Join Our WhatsApp Group

    Recent Posts

    Sign up for our Newsletter

    “Let’s explore the new avenues of Urban environment together “

    E-Book- From Thesis To Portfolio

    A Guide to Convert Academic Work into a Professional Portfolio